Yet Another One More Thing… New Web Inspector!
As some of you saw last week at WWDC, we have a brand new version of the Web Inspector. We know that a lot people have found the current Web Inspector useful, and we have gotten a lot of feedback and suggestions about how to make it even better. And boy have we been listening! We have taken the current Web Inspector and have added a bunch of new features that you will find invaluable for web development:
- Completely redesigned interface, no longer a transparent panel
- Works with any WebView inside third-party applications, not just Safari
- Supports docking to the inspected page
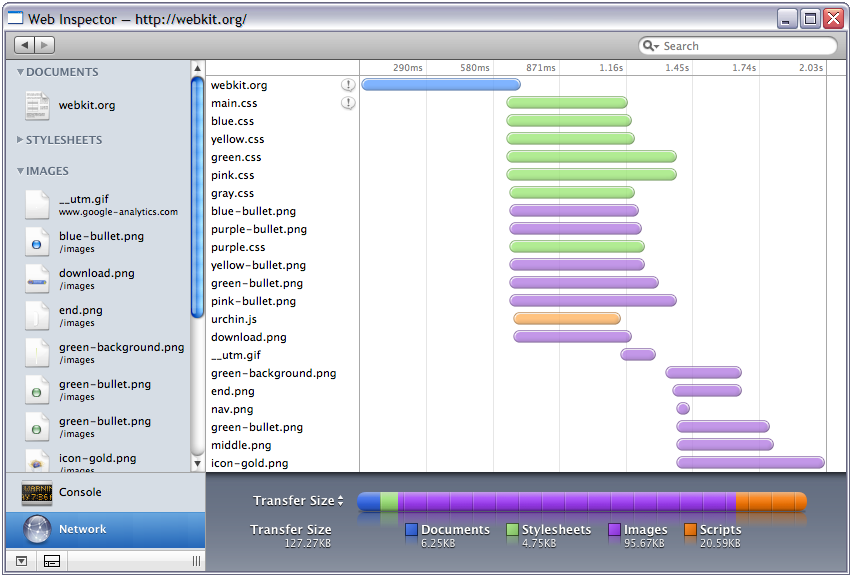
- Shows all resources included by the page, sorted into categories
- Global search through all text-based resources
- Console to show errors and warnings with live JavaScript evaluation
- Network panel showing resource load timeline along with HTTP request and response headers
- Resource size and load time summary graph in the Network panel
- Syntax highlighted HTML source
- Inline JavaScript and HTML error reporting
We will be telling you in more detail about all of the great new features in future blog posts. We have been working on this for a long time, but now we want to get the whole WebKit community involved with making this the best web development tool available. So show up in #webkit or on the mailing list and suggest new ideas or implement them yourself (remember everything is HTML, JavaScript and CSS)! And there is one more thing… all of this new inspector goodness also works on Windows. The new inspector is available in the Mac and Windows nightly builds.