Web Inspector Updates
A number of exciting new features have been added to the Web Inspector since our last update. Today we would like to highlight some of those features! This post is also available in Japanese (日本語), thanks to Keishi Hattori (服部慶士).
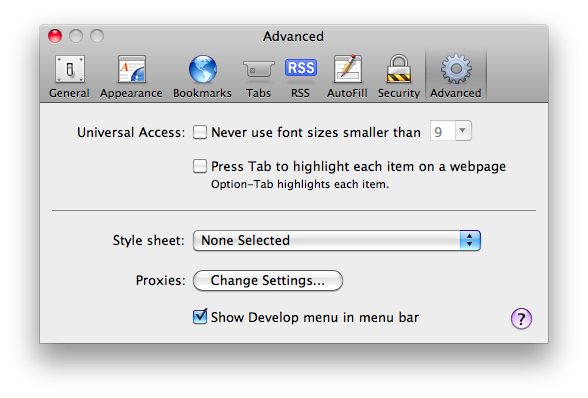
If you would like to play with most of these features you will need to be running a recent WebKit Nightly. Once downloaded make sure that you enable the Web Inspector by checking “Show Develop menu in menu bar” under the Advanced tab in the Preferences.
Editing Element Attributes and Style Properties #
Editing Element Attributes and Style Properties has been made even simpler and more developer friendly. The interfaces for editing attributes and properties now support tabbing to allow you to move between items, and create new items with ease.
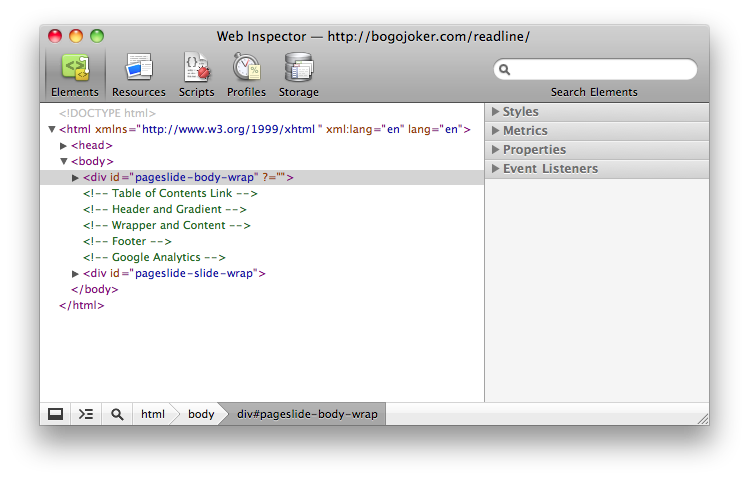
Besides tabbing you can also add a new attributes to a node. Start by hovering over the node in the Element’s Tree Hierarchy and after a polite wait a clickable template for a new attribute will appear.
Related Bug Reports: Add Element Attributes, Tabbing, and Improved UI.
Creating and Modifying CSS Rules and Selectors #
A powerful new feature in the Web Inspector allows you create new or modify existing CSS Rules and Selectors. We expect both developers and designers will find this very useful when experimenting with new ideas or tweaking existing designs.
The interface for working with selectors starts with a new Gear Menu in the Styles Sidebar Pane. Select “New Style Rule” and a new section will be created for you, pre-populated with an intelligent selector from the selection in the Elements Tree Hierarchy. Editing selectors is activated by double-clicking. Once again, tabbing will allow you to navigate between selectors and their properties.
When editing selectors there is visual feedback when you create or modify a selector that does not affect the selected node in the Elements Tree Hierarchy. This indicator helps detect errors when making changes.
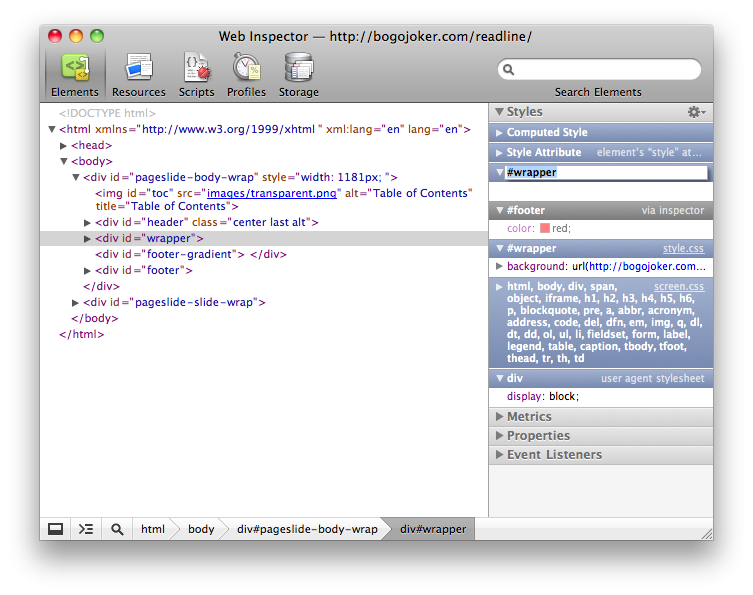
One more tweak to the Styles Pane is that there is always a section for the selected node’s style attribute. This allows you to easily add style information to the node as you usually would via the Styles Pane instead of editing or creating a “style” attribute. This section is nearly always on top due to how CSS specificity works.
Related Bug Reports: Selectors Support and Move to Gear Menu.
CSS Color Representations #
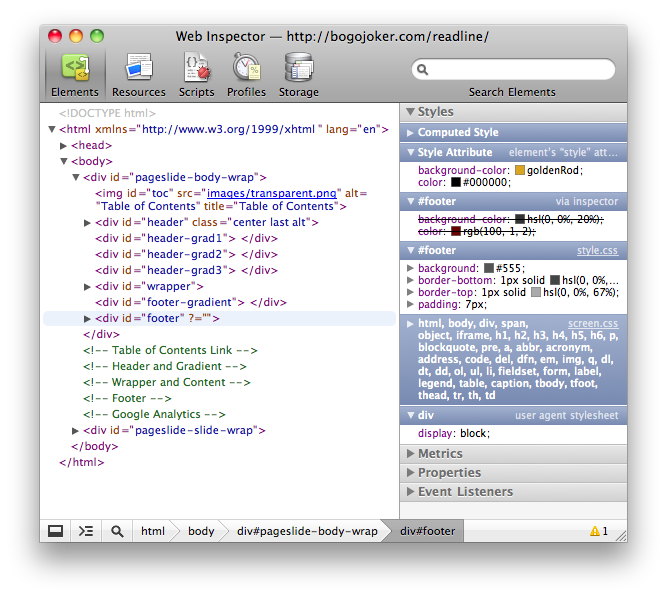
Colors in the Styles Pane can be shown in any of their possible representations. For simple colors this includes short hex, full hex, rgb, hsl, and potentially a nickname. For advanced colors this includes rgba and hsla. For example the color “white” can be represented as: #FFF, #FFFFFF, rgb(255, 255, 255), hsl(0, 100%, 100%), and white.
You can use the Styles Pane’s Gear Menu to set your preferred representation. However, if you want to cycle through an individual color’s different representations you can do so by clicking on its associated color swatch.
Related Bug Reports: Color Representations, Preference and Gear Menu, and UI Improvement.
DOM Storage #
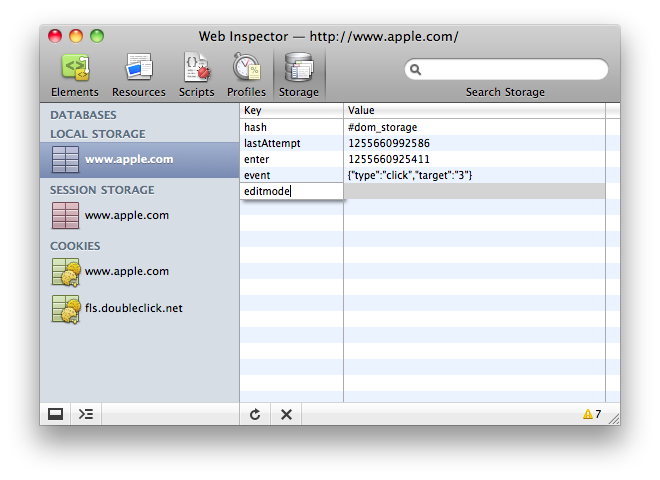
The Storage Panel (formerly the Databases Panel) now allows you to monitor DOM Storage areas like localStorage and sessionStorage in a familiar datagrid. The DOM Storage datagrid displays live updates so monitoring changes is possible without manually refreshing the view.
Also, the familiar creation and editing techniques apply to the datagrid. To add a new key/value pair just double-click in any open area, or double-click an existing item to start editing. Tabbing works as you would expect.
Related Bug Reports: DOM Storage Support, Live Updates, Create New Items, and Tabbing.
Keyboard Shortcuts #
Keyboard shortcuts are always desired by developers. They can be hard to discover, so here is a complete list and here are the ones that were added recently:
- Switch Panels — Command-[ and Command-] on a Mac or Control-[ and Control-] on other platforms.
- Delete a Node in the Tree Hierarchy — either Delete or Backspace keys will do the trick.
- Quick Edits in the Tree Hierarchy — Hitting Enter or Return on a Node in the Tree enters the editing mode for that type of Node. For a Text Node you will start editing the content. For Element Nodes you start editing the first attribute, or, for convenience, a new attribute will be added for you.
The Scripts Debugger was updated to support some popular keyboard shortcuts:
- Continue — F8 or Command-/ on a Mac or Control-/ on other platforms.
- Step Over — F10 or Command-‘ on a Mac or Control-‘ on other platforms.
- Step Into — F11 or Command-; on a Mac or Control-; on other platforms.
- Step Out — Shift-F11 or Shift-Command-; on a Mac or Shift-Control-; on other platforms.
- Next Call Frame — Control-. on all platforms.
- Previous Call Frame — Control-, on all platforms.
- Evaluate Selection When on a Breakpoint — Shift-Command-E on a Mac or Shift-Control-E on other platforms.
Related Bug Reports: Switch Panels, Delete Node, Quick Edit, General Debugger Shortcuts and Evaluate Selection.
Cookies #
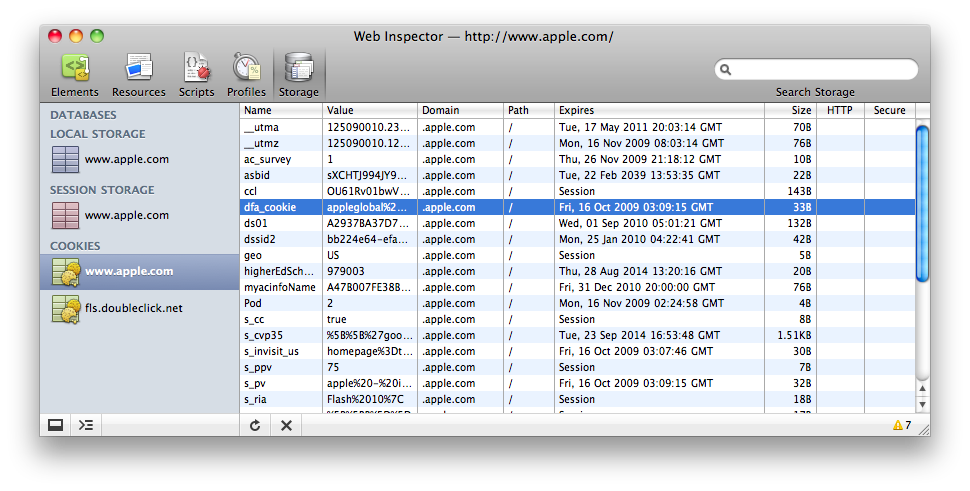
Viewing Cookie information is now possible under the Storage Panel. Supported platforms show all of the cookies and their hidden information for all domains accessed on the inspected page. Cookie information includes the name, value, path, expiration date, http only flag, and secure (https) flag. Supported platforms may also delete cookies.
If your platform doesn’t have full support you aren’t left in the dark. You will still be able to see the keys and values of the cookies that are accessible via JavaScript on the inspected page.
Related Bug Reports: Initial Support, Hidden Data 1 and 2, Cookies for Sub-Resources, and UI Improvements
Event Listeners #
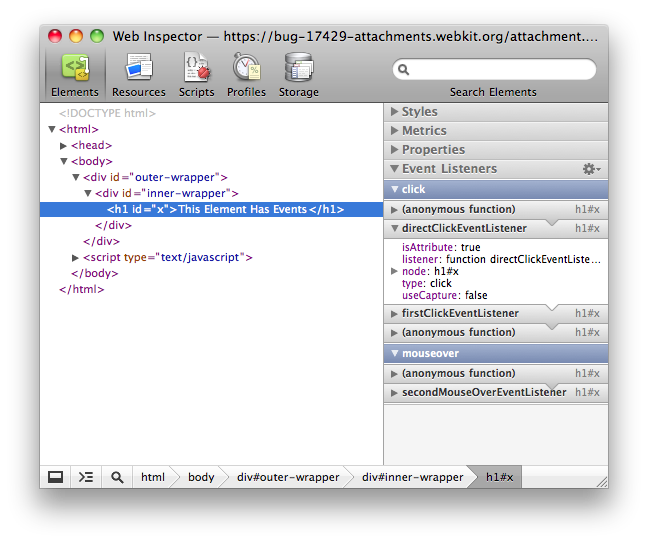
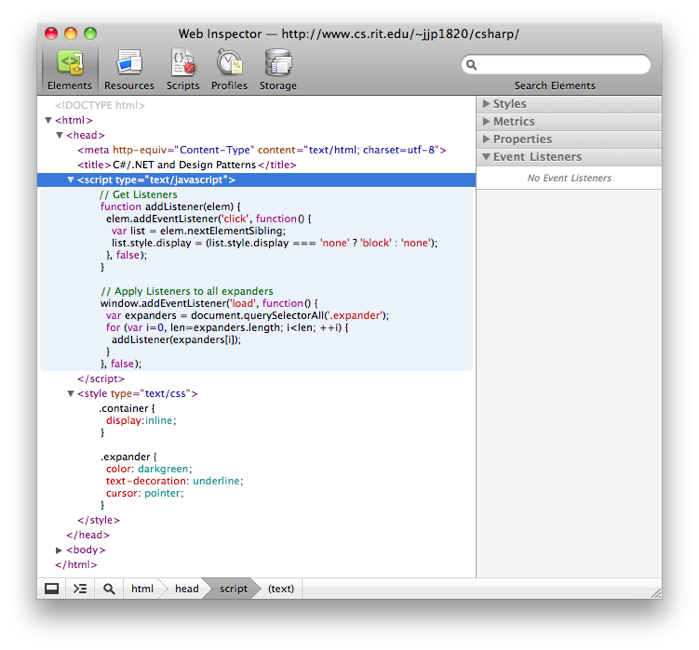
A new Sidebar Pane has been added to the Elements Panel which displays the registered Event Listeners for the selected node. The Event Listeners that are shown for the selected node are in the exact order that they are fired through the Capturing and Bubbling phases. This provides developers with the most accurate and useful information possible.
The user interface shows the registered Event Listeners separated by type. If a node has both “onclick” and “onmouseover” listeners then they will naturally appear in different sections. You can also set your filter preference using the Gear Menu. You can choose to see only the listeners registered on the selected node, or the entire event flow.
We are actively looking for UI improvements in this area. So if you have some ideas or feedback please feel free to let us know on this bug report!
Related Bug Reports: Event Listeners.
Syntax Highlighting #
Syntax highlighting enhances readability, makes debugging code easier, and looks really awesome. The Web Inspector now includes syntax highlighting for JSON and CSS.
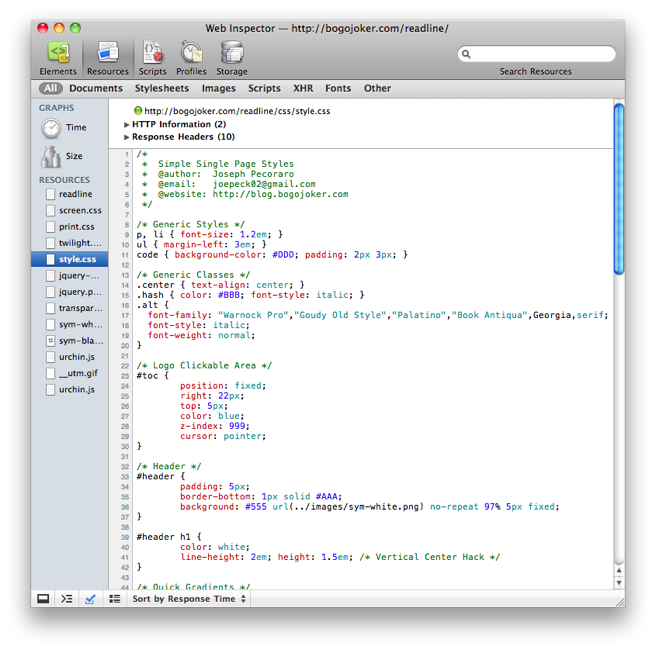
CSS Syntax Highlighting even works on the more complex “at-rules” such as @import, @media and @font-face. In addition to supporting the syntax highlighting in the Resources Panel, inline scripts and styles in the Elements Tree Hierarchy are syntax highlighted!
Related Bug Reports: JSON Highlighting, CSS Highlighting, and Inline Highlighting.
Breakpoints and Watch Expressions #
The Script Debugger continues to become more powerful and more useful. We already mentioned the keyboard shortcuts above, but there are plenty of other enhancements.
There is a new Breakpoints Sidebar Pane that allows you to easily monitor and work with your breakpoints across all files without the hassle of searching for them. Each sidebar entry shows the source line and contains a checkbox that allows you to directly enable or disable the breakpoint. Clicking on the entry will jump you directly to the highlighted line in the source file. Finally, deleting a breakpoint has been made easier by clicking the “blue tag” breakpoint indicator. The tag will cycle through its three states of active, inactive, and removed.
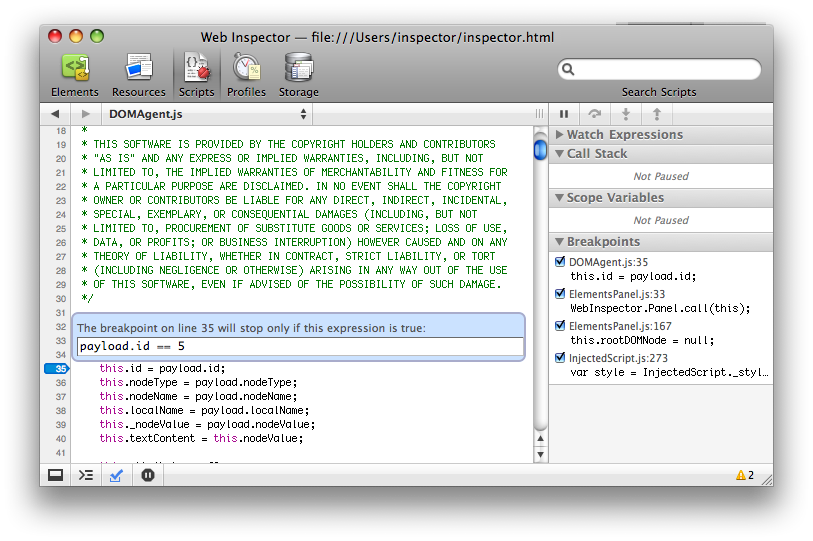
A powerful feature added to the debugger is Conditional Breakpoints. Once you have a breakpoint set, right click on the “blue tag” breakpoint indicator and you will get a popup asking for a conditional statement for that breakpoint. Simply provide an expression and the breakpoint will only pause from then on only if the condition is true.
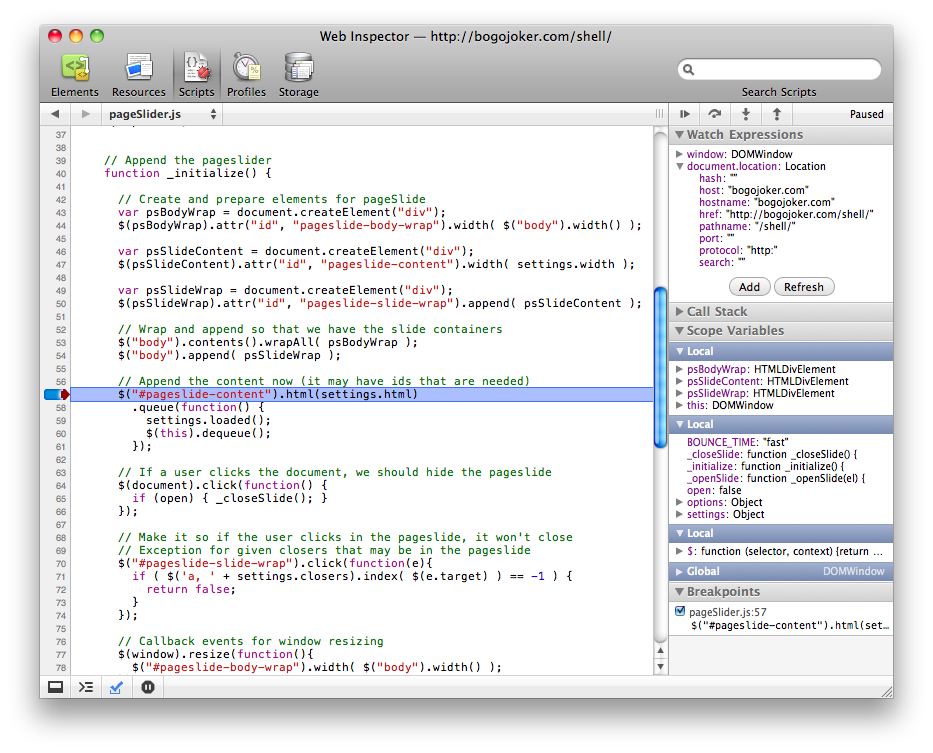
Another new feature in the Debugger is Watch Expressions. In this new Sidebar Pane you can add any number of expressions that evaluate in the global scope normally but in the local scope when paused in the debugger. Once added you get the full Object Properties tree view of the values of each expression. These watch expressions automatically refresh when the debugger pauses. They are also persist across page loads.
Related Bug Reports: Breakpoints Sidebar Pane, Watch Expressions, Evaluate on Breakpoint, Conditional Breakpoints, and Delete Breakpoints.
Debugging AJAX #
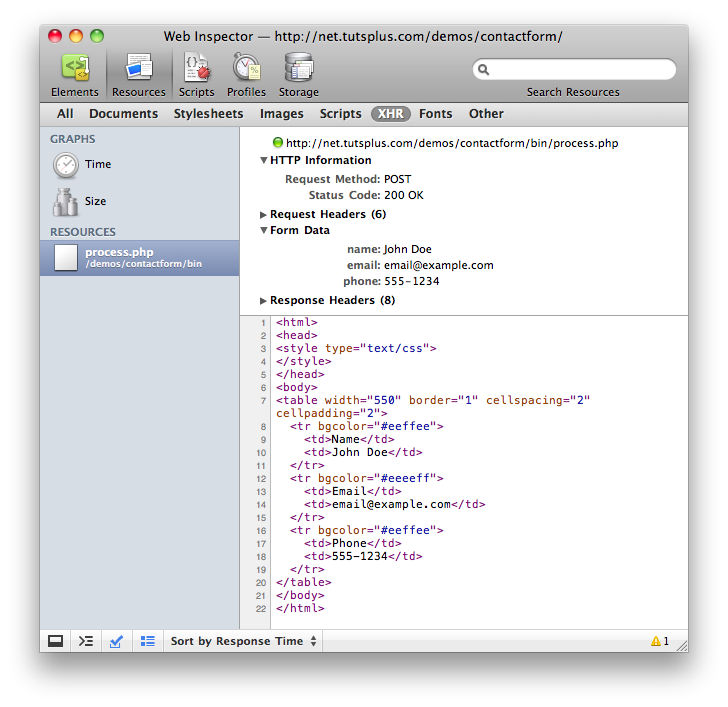
An extremely valuable feature for developers working with AJAX is the ability to view the exact parameters and payload sent on XMLHttpRequests.
In the individual resource view there are new sections for viewing submitted Form Data, Query String Parameters, and Request Payloads when appropriate. You can toggle viewing the information in its unencoded (default) and encoded forms with a double-click.
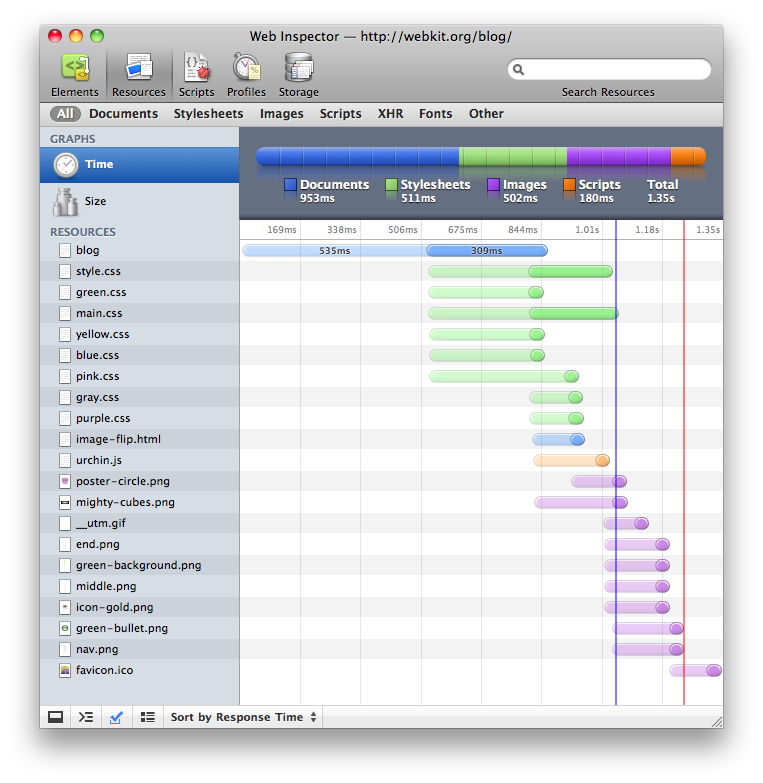
There is also new section named HTTP Information which contains the Request Method (GET, POST, etc.) and the Status Code (200, 404, etc.). Additionally, it adds a colored dot next to the requested URL to show the status (green for success, orange for redirect, and red for error).
Related Bug Reports: HTTP Status Code and Data, Parameters, and Payload
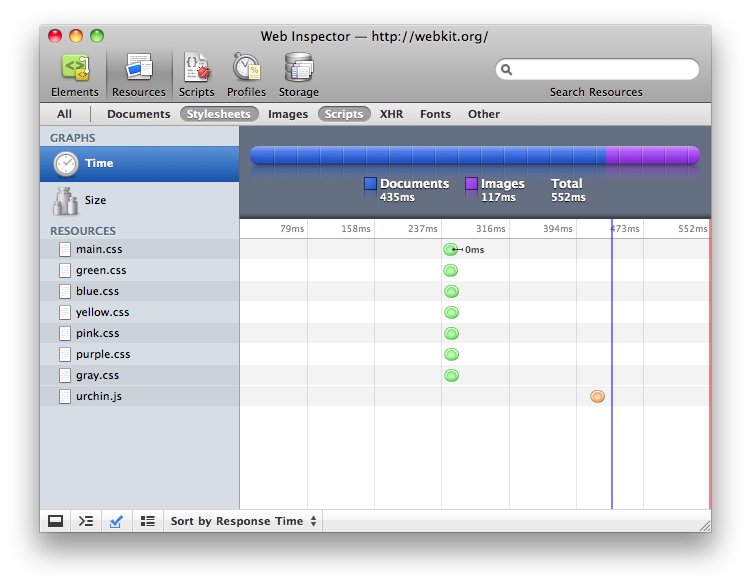
Resources and Console Scope Bars #
In order to filter through the Resources or Console messages the Web Inspector now sports some familiar Scope Bars. This has proven to be very useful in the Resources Panel for easily viewing all resources of a particular type.
Related Bug Reports: Resources Scope Bar and Console Scope Bars.
Resources Timeline #
The Web Inspector now specifically shows in the timeline when the DOMContentLoaded and Load events fire. This helps clarify the time it takes for pages to load and helps you improve your websites load times.
Related Bug Reports: Show Load Lines
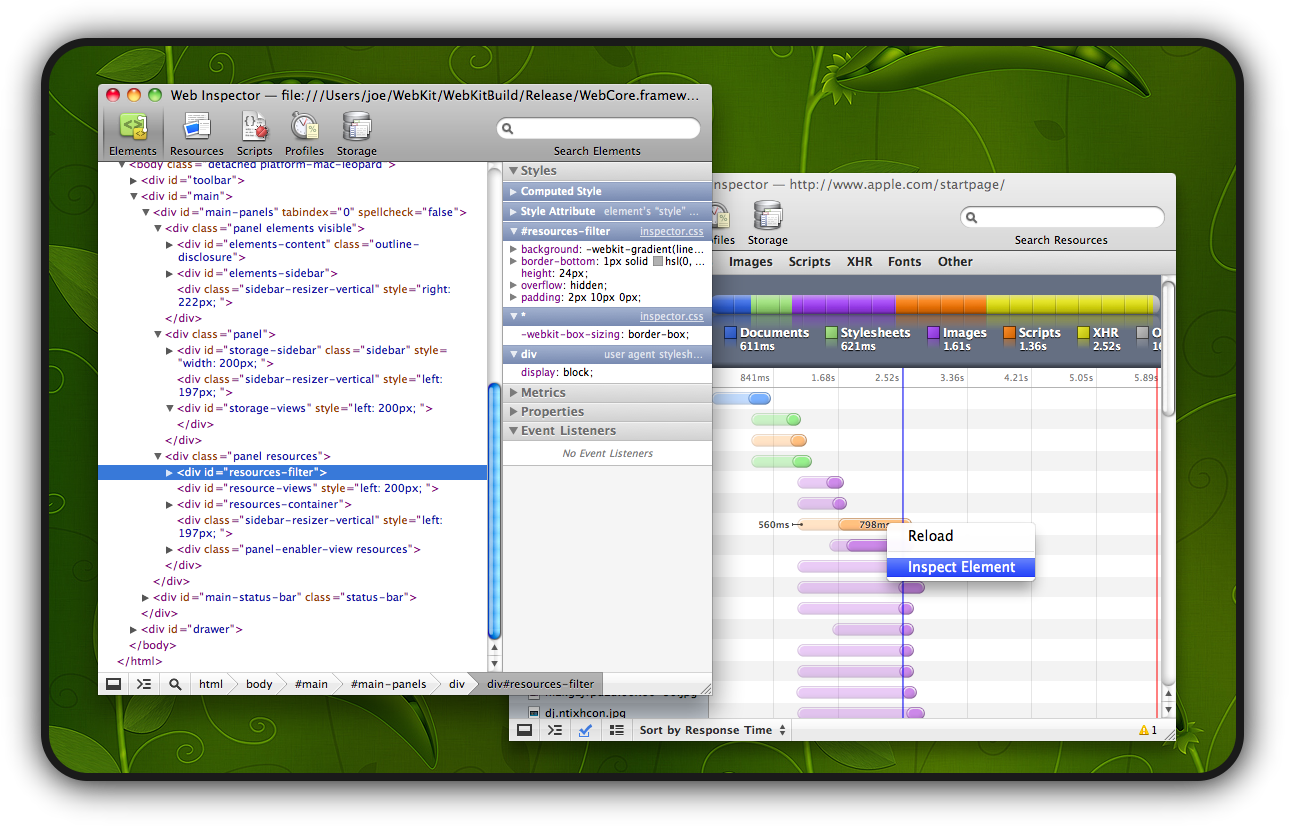
Resources Interactivity #
A couple new features allow you to more directly access individual resources from within the Web Inspector. Instead of copying their URL and opening a new tab manually you can now double-click the Resource in the sidebar to open it directly in a new window. Or, you can drag and drop the resource using HTML5 drag and drop events!
Related Bug Reports: Open Resource Directly and Drag and Drop.
Console Improvements #
Properties in the Web Inspector’s Console are now sorted in a much more natural and useful way. By sorting keys alphanumerically Arrays with greater then 10 elements are much easier to work with.
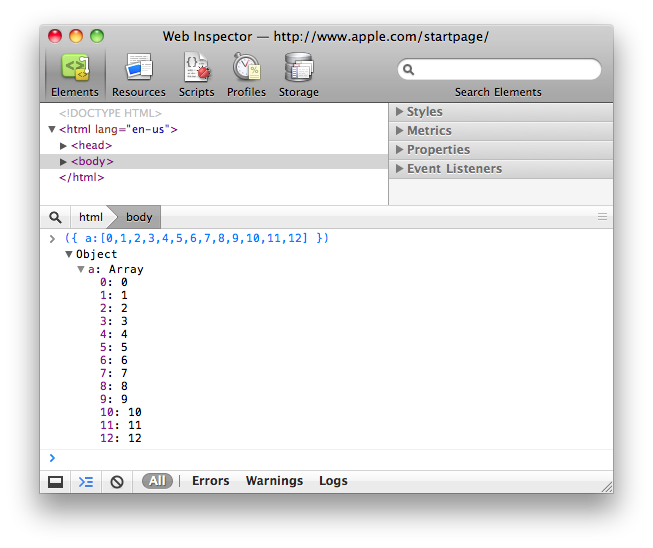
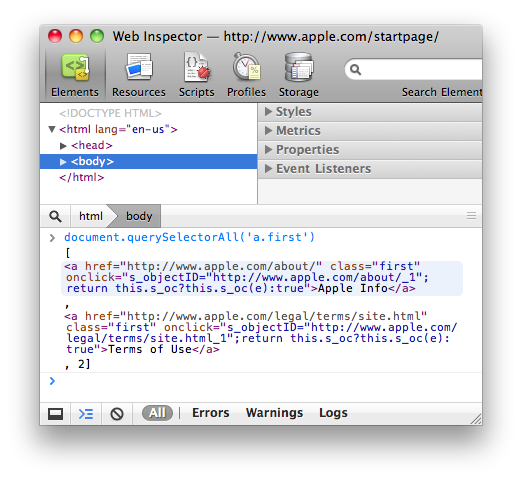
Another tweak is that collections such as NodeLists and HTMLCollections are now displayed like Arrays. This meaning that their contents are shown directly in the console, no longer requiring any extra boilerplate.
Related Bug Reports: Sorting and NodeLists.
Firebug Command API Improvements #
More improvements have been made to support more of the Firebug Command Line API. The Web Inspector now supports the inspect() function, which can take an Element, Database, or Storage area and automatically jumps to the appropriate Panel with information. Also, the $0–$4 variables contain the current and previous selected nodes from the Elements Tree Hierarchy.
These command line APIs are usable inside the Web Inspector’s Console. To make working with these APIs even easier, they now show up in the Console’s autocompletion.
Related Bug Reports: $# Variables, inspect() Function, and Autocompletion.
How You Can Contribute #
Many of these new features were added by members of the Open Source Community. We would like to encourage you to contribute as well! Since the Web Inspector itself is mostly HTML, JavaScript, and CSS that means that you already have the skills you need to join in! Interested? Play around right now by inspecting the inspector itself!
If you’re interested in contributing and have any questions please stop by the #webkit-inspector IRC channel! As an encouragement to developers, included at the end of each section above are the core bug reports that were involved in bringing each of these features to life.
Finally, if you have ideas for new features, any improvements, or if you’ve stumbled across a bug then please don’t hesitate to create a bug report. This link has pre-populated most of the fields so that you only need to fill out the Summary and Description. As always you should do a quick search through the existing inspector bugs first.