Introducing the Web Inspector
I would like to introduce a new addition to WebKit—the Web Inspector. The Web Inspector lets you browse the live DOM hierarchy in a compact HUD style window, catering to the needs of web developers and WebKit hackers alike.
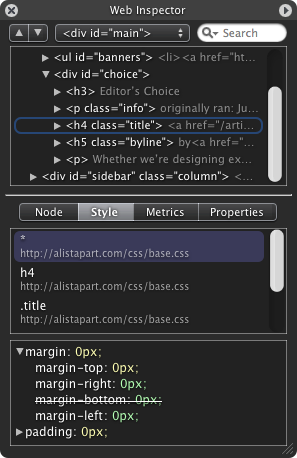
The Web Inspector highlights the node on the page as it is selected in the hierarchy. You can also search for nodes by node name, id and CSS class name.
One of the unique features of the inspector is the ability to root the DOM hierarchy by double clicking a node to dig deeper. This lets you easily manage large nested pages and only focus on a particular sub-tree with minimal indentation.
Under the Style pane we show all the CSS rules that apply to the focused node. These rules are listed in cascade order with overridden properties striked-out—letting you truly see how cascading stylesheets affect the page layout. All shorthand properties have a disclosure-triangle to show and hide the expanded properties created by the shorthand.
So update your tree or download the nightly and give the new Web Inspector a try. The nightly always has the Web Inspector enabled. However, to enable the inspector for your own build, you will need to type the following in the Terminal once:
defaults write com.apple.Safari WebKitDeveloperExtras -bool true
You will then see a new “Inspect Element” contextual menu item on any web page. This will open up the Web Inspector and refocus to the node under your cursor.
We have added a new “Web Inspector” component to Bugzilla to track any issues of feature requests you might have.
I would like to give a big thank you to Dave Hyatt for all the low-level support and design ideas, as well as Geoff Garen and Maciej for helping to brainstorm a great user interface.