Introducing the Rendering Frames Timeline
Being able to measure performance and identify bottlenecks is essential for web developers of modern web applications. Delivering a smooth user experience can be a challenge as complex scripts, dependencies on third-party JavaScript frameworks, and high performance animations become the norm. Most of today’s devices have displays which refresh at 60 Hz, which means our apps need to update at a consistent 60 frames per second.
Web Inspector includes a new tool to help locate and resolve rendering performance issues. In addition to the familiar event-based timelines, the Timelines tab now includes a Rendering Frames mode, a new timeline presenting a frame-based, task-specific view of existing profiler/instrumentation data.

The Event Loop
Each frame in the timeline represents a single cycle of the browser’s event processing loop, broken down into the tasks that executed during that time. During a single cycle of the event loop, the browser must:
- Handle events and timers
- Run JavaScript
- Perform style calculations and layout
- Paint and composite the page
If one or more of these tasks takes an excessive amount of time, frame rates can drop and page performance can suffer. To maintain a consistent 60 FPS frame rate, the time budget for each frame is about 16.667 ms, or 1 / 60 of a second.
Overview
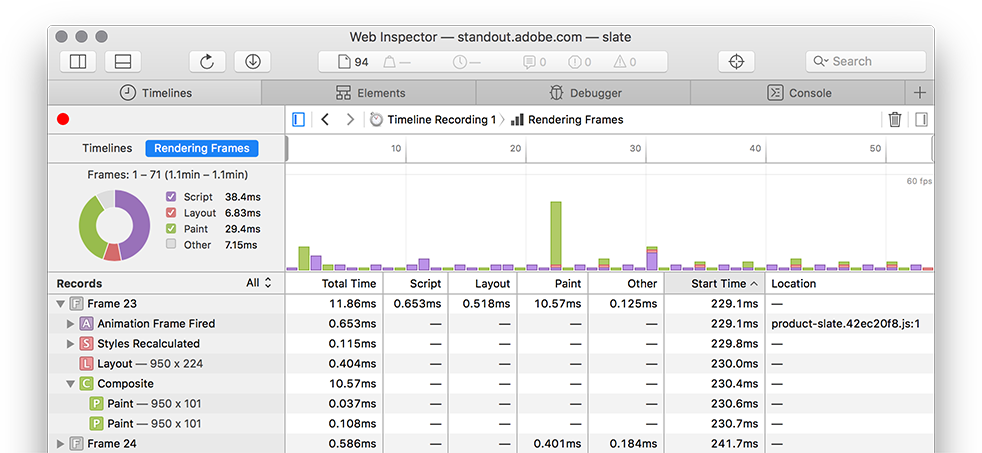
Frame data is displayed in three panels: an overview graph, records table, and summary chart. The graph panel (at the top of the view) shows a high-level overview of rendering times and long-running tasks. The records table (bottom half) shows details about what happened in every single frame, and the summary chart gives the aggregate time for the frame records currently selected in the timeline.
The Rendering Frames timeline plots discrete frames along the x-axis; each frame’s height corresponds to how long it took to render (lower is better). This is in contrast to other timelines in the Web Inspector, which plot events over time on the x-axis and don’t have a y-axis.

When there’s no script activity or layout changes to render, WebKit’s event loop remains idle. By default, the Rendering Frames timeline automatically hides these idle periods so you can easily compare periods of activity.
The above example shows a profile taken from a page that performed some work once per second with a call to setInterval. According to the Start Time column, each frame is about one second apart, and the interval between frames – idle time – is not shown.
Identifying Performance Problems
When web content has poor rendering performance, this shows up as tall bars in the timeline or frames with large values in the Total Time table column. Filters, which are discussed in the next section, can also aid in highlighting just those frames which consistently fail to meet our 60 FPS goal. The next step is determining what script or layouts are eating up our frame budget:
Filtering Data
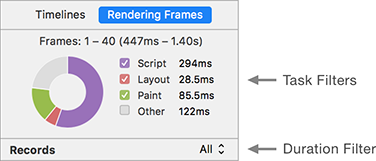
When rendering up to 60 frames per second, complex web content can quickly generate large recordings that obscure infrequent, but annoying, frame drops. The Rendering Frames timeline adds two new filter types to help reduce the noise: a task filter and frame duration filter. Both filter options are located in the Timelines sidebar panel.
As with all timeline views, only the range of data selected in the timeline overview graph is shown in the records table.

All selected frames are shown in the overview graph and data grid by default. In the example below, this includes many frames well within the ~16 ms budget, and quite a few that are little more than a blip on the graph:

Duration filters are useful for hiding frames that don’t take a significant time to render. Below is the same data after filtering out frames which took less than 15 ms to render:

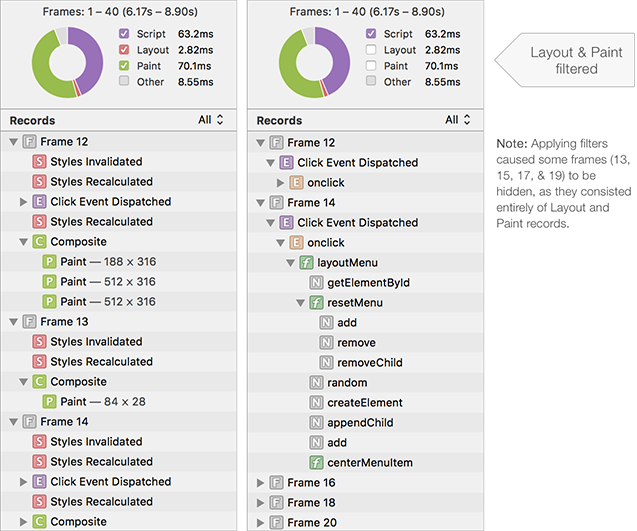
Filtered frames are de-emphasized in the overview graph, and hidden in the timeline records table. Applying filters reduces the amount of profile data which must be investigated. Data can be filtered even further by applying task filters:

Final Thoughts
Knowing how your site spends its time is crucial for delivering smoothly rendered content and a snappy user experience. The Rendering Frames timeline is a great tool for identifying performance issues, and this is just the beginning. There are many enhancements and features planned for this and other areas of the Web Inspector, and we’re interested in hearing your feedback.
The Rendering Frames timeline is available to use in the Safari 9 beta, and the latest features and enhancements can be found in WebKit Nightly Builds. Help us make Web Inspector even better by sending us feedback on Twitter (@xeenon, @jonathandavis, @matt_a_baker), or by filing a bug.