Web Inspector ReferenceNetwork Tab
The Network Tab shows a table of every resource that has been requested since Web Inspector was opened. In addition to CSS, JS, and HTML resources, the table also includes API-driven network requests such as XHR, fetch, WebSocket, navigator.sendBeacon, etc.
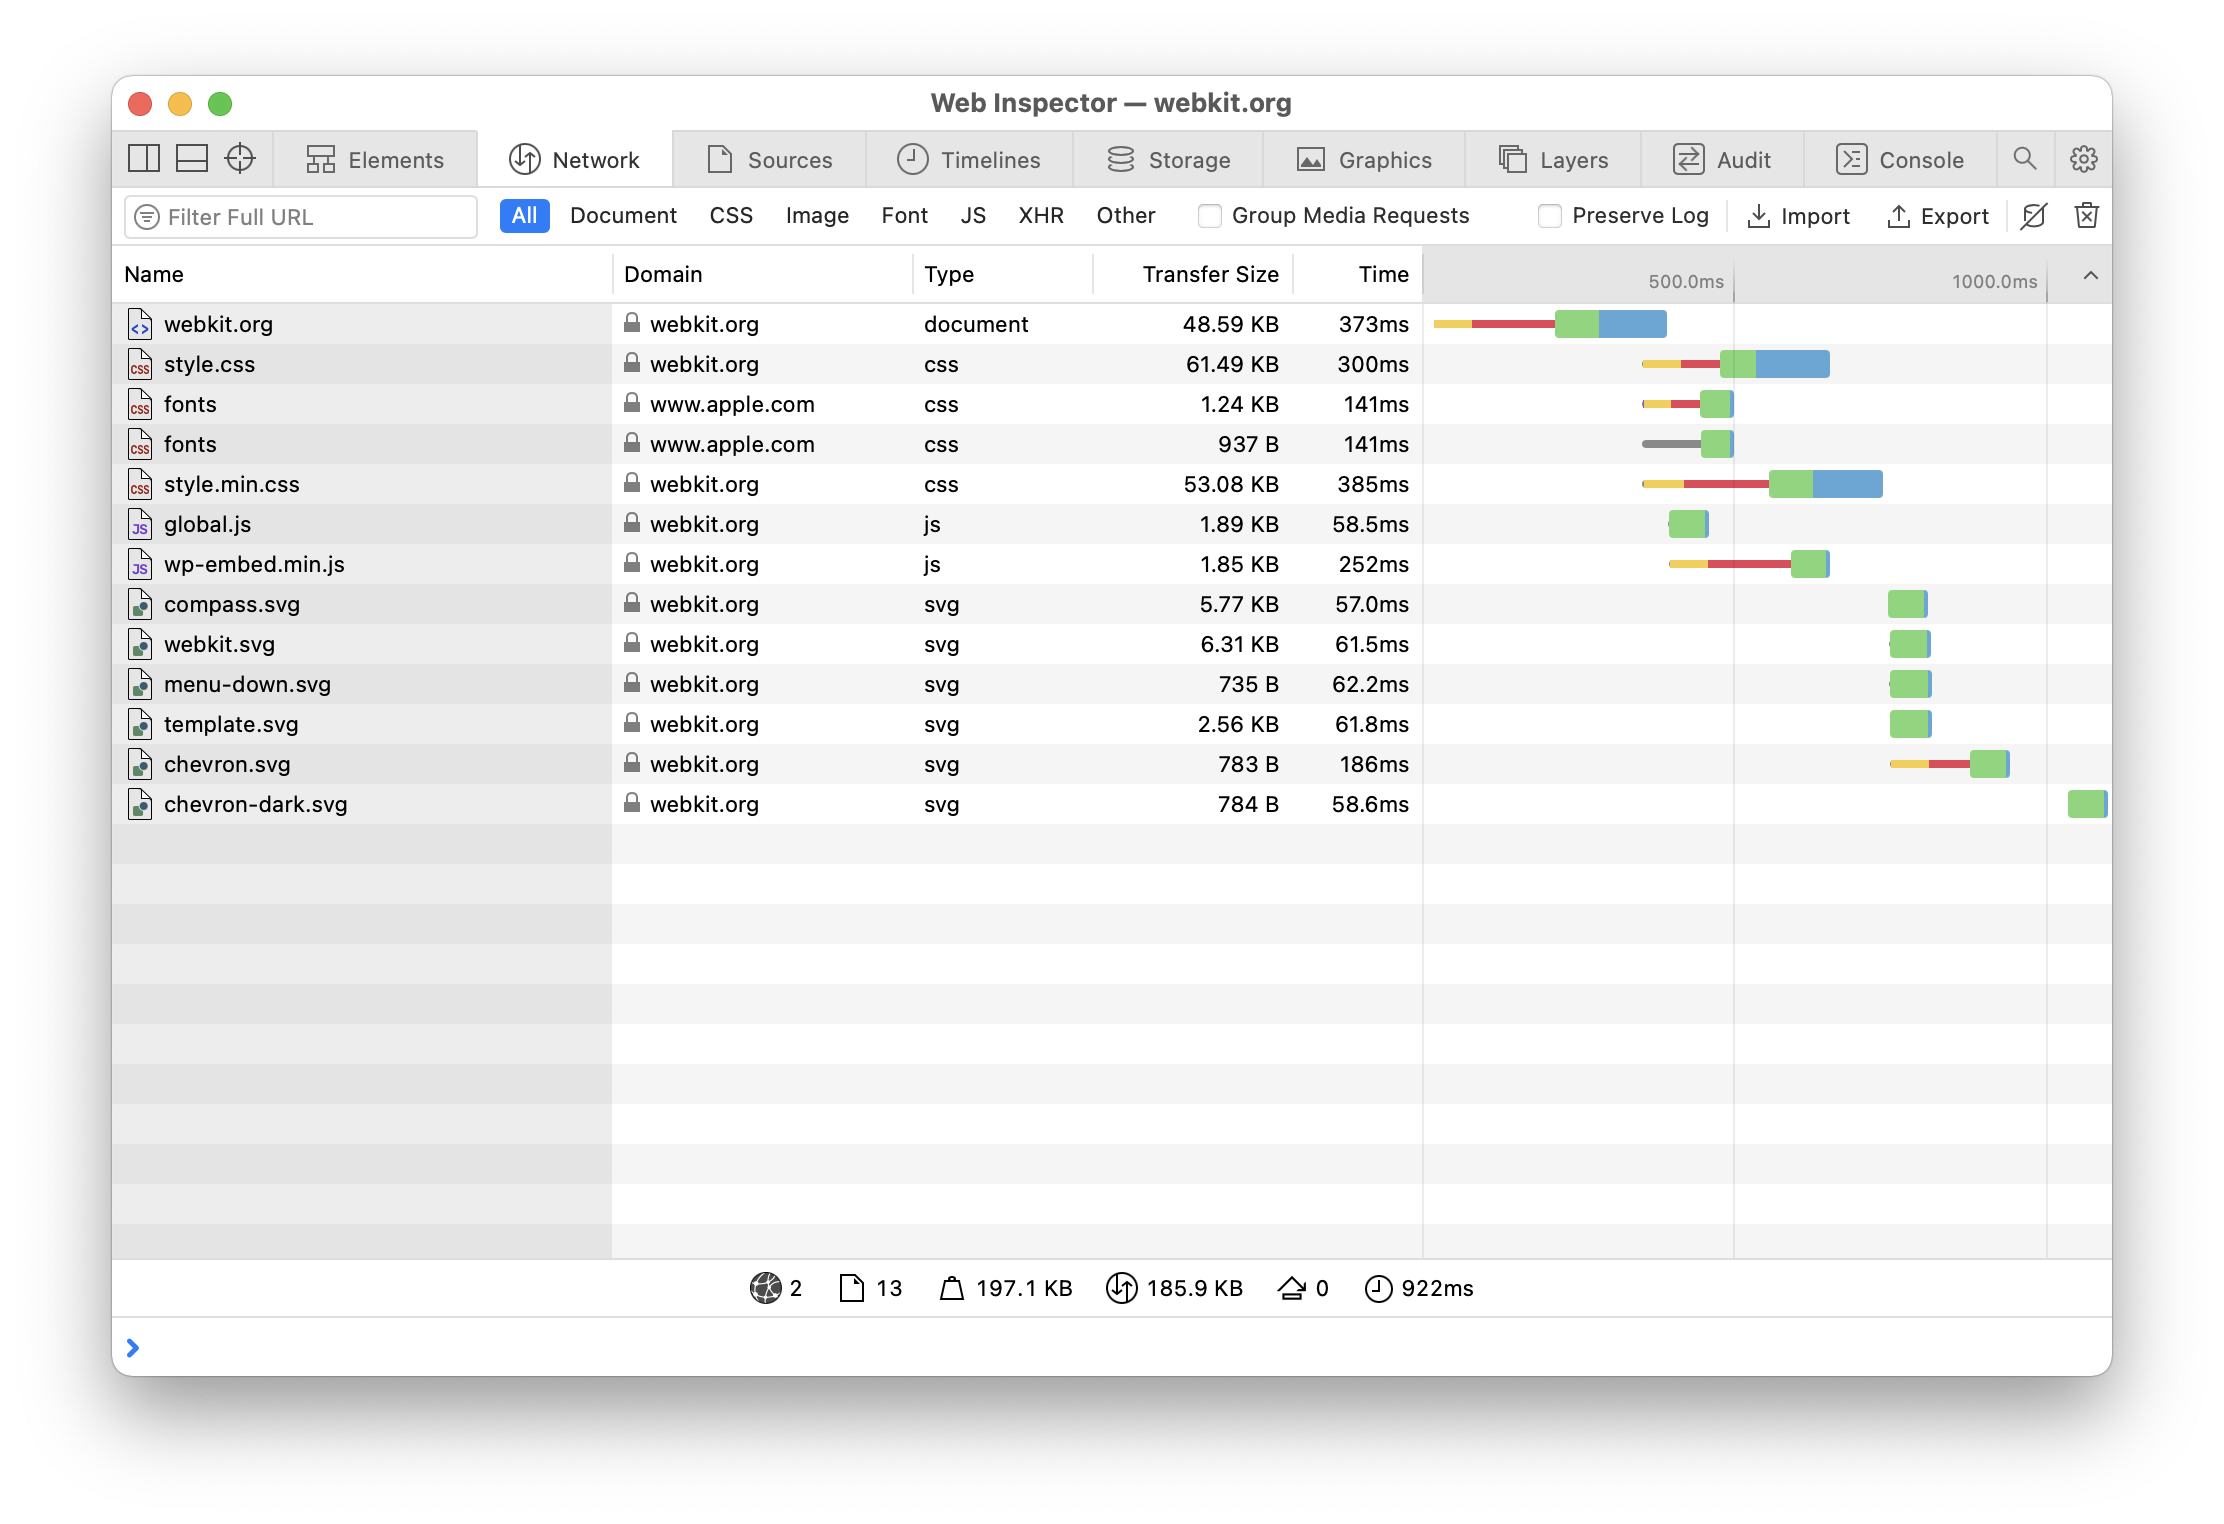
By default, each resource in the table is sorted based on when the resource request began. Columns can be shown/hidden by right-clicking on the header of the table and checking/unchecking the desired column. In addition to the columns shown above (Name, Domain, Type, Transfer Size, Time, and the Waterfall), there are also columns that can be shown for MIME Type, Method, Scheme, Status, Protocol, Initiator, Priority, IP Address, Connection ID, and Resource Size.
Resources in the table can be filtered either via the URL input or the resource type segmented controls found above the table. It’s also possible to keep the items currently in the table from being replaced during page navigations by checking Preserve Log.
Statistics about the resources currently shown in the table are listed below the table:
"load"event was fired.
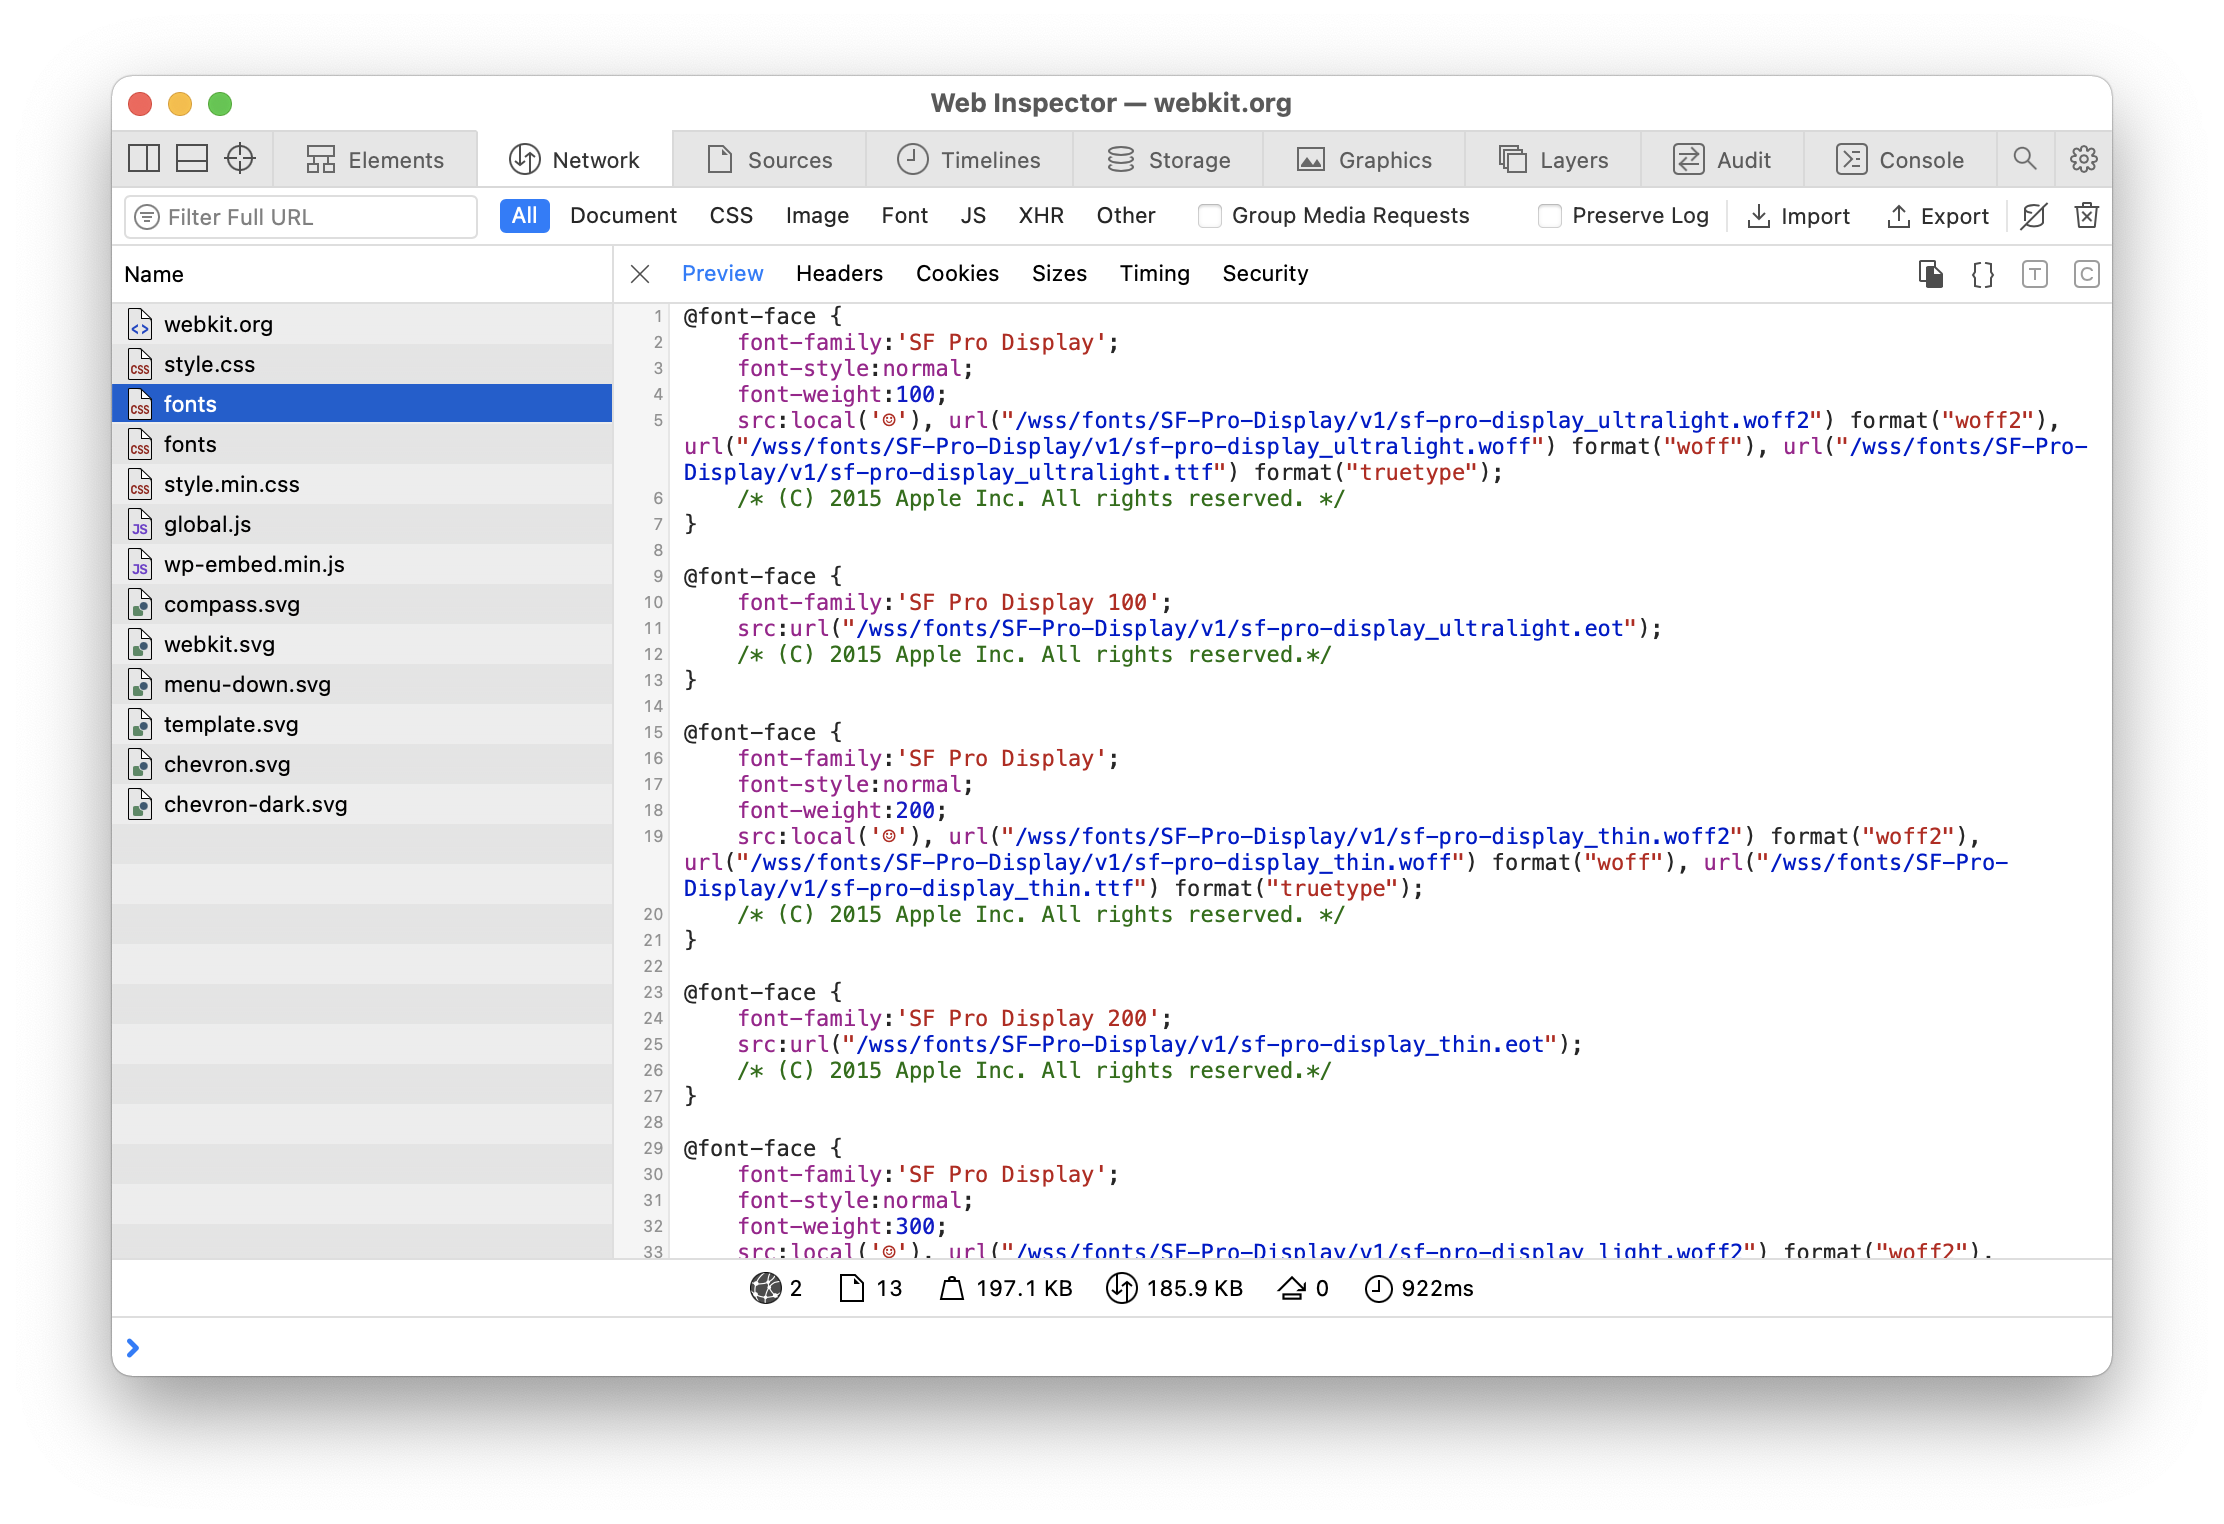
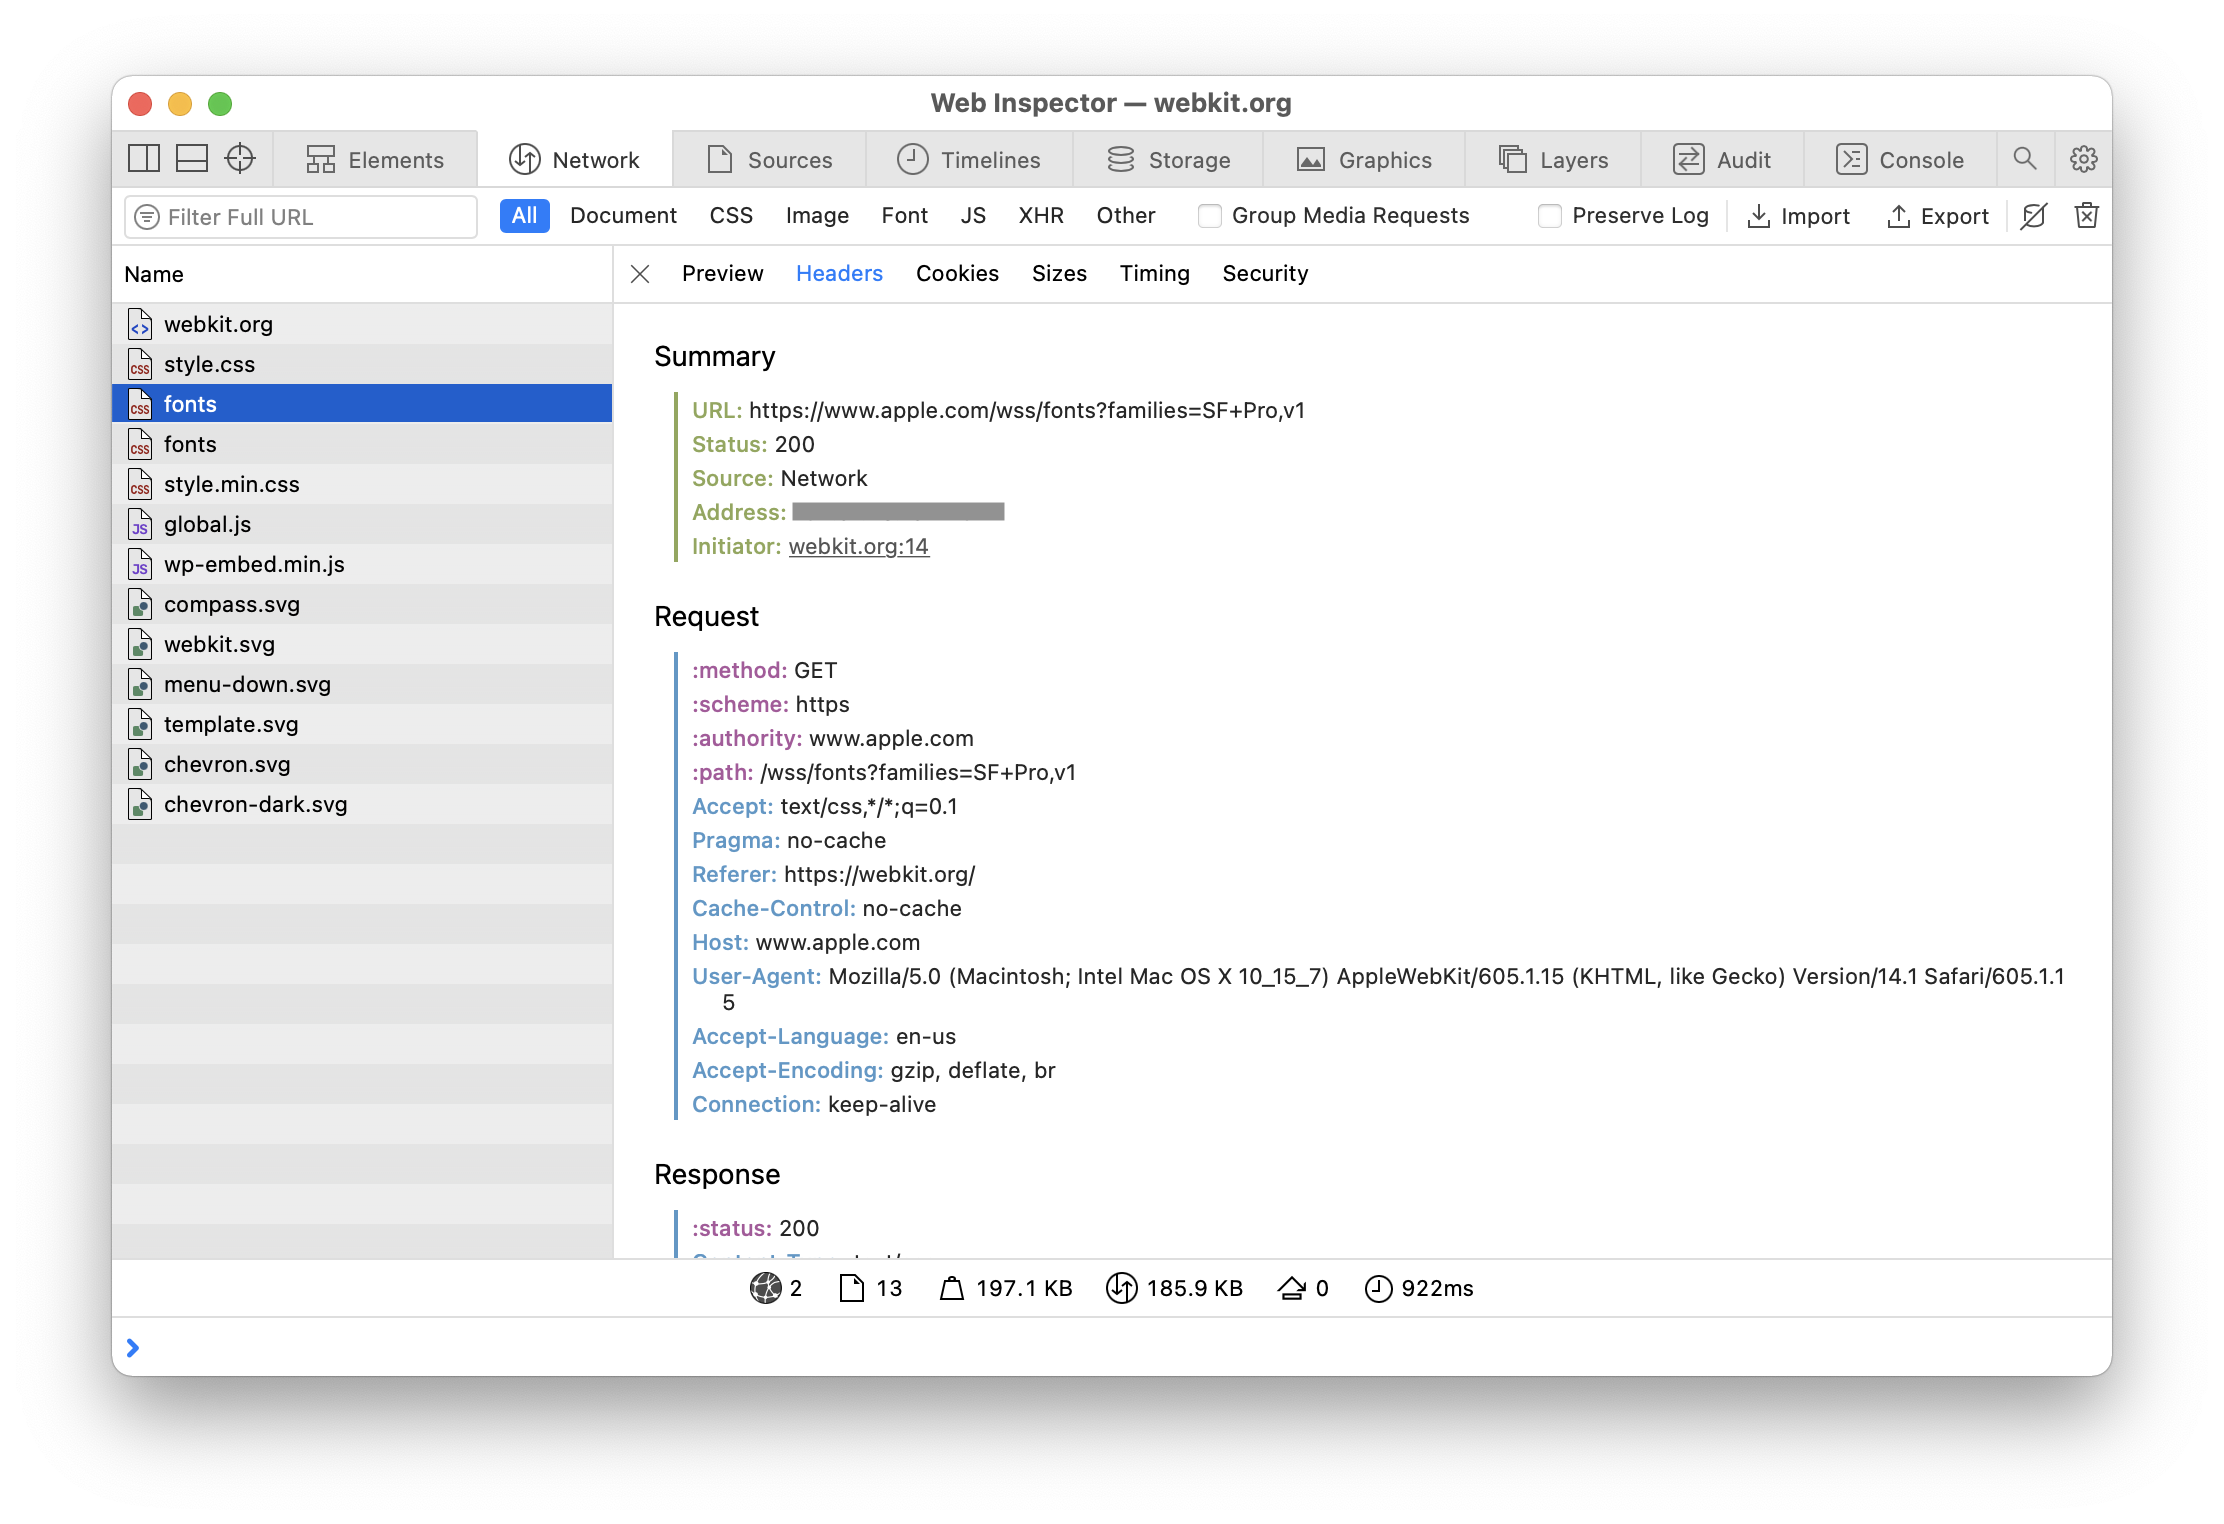
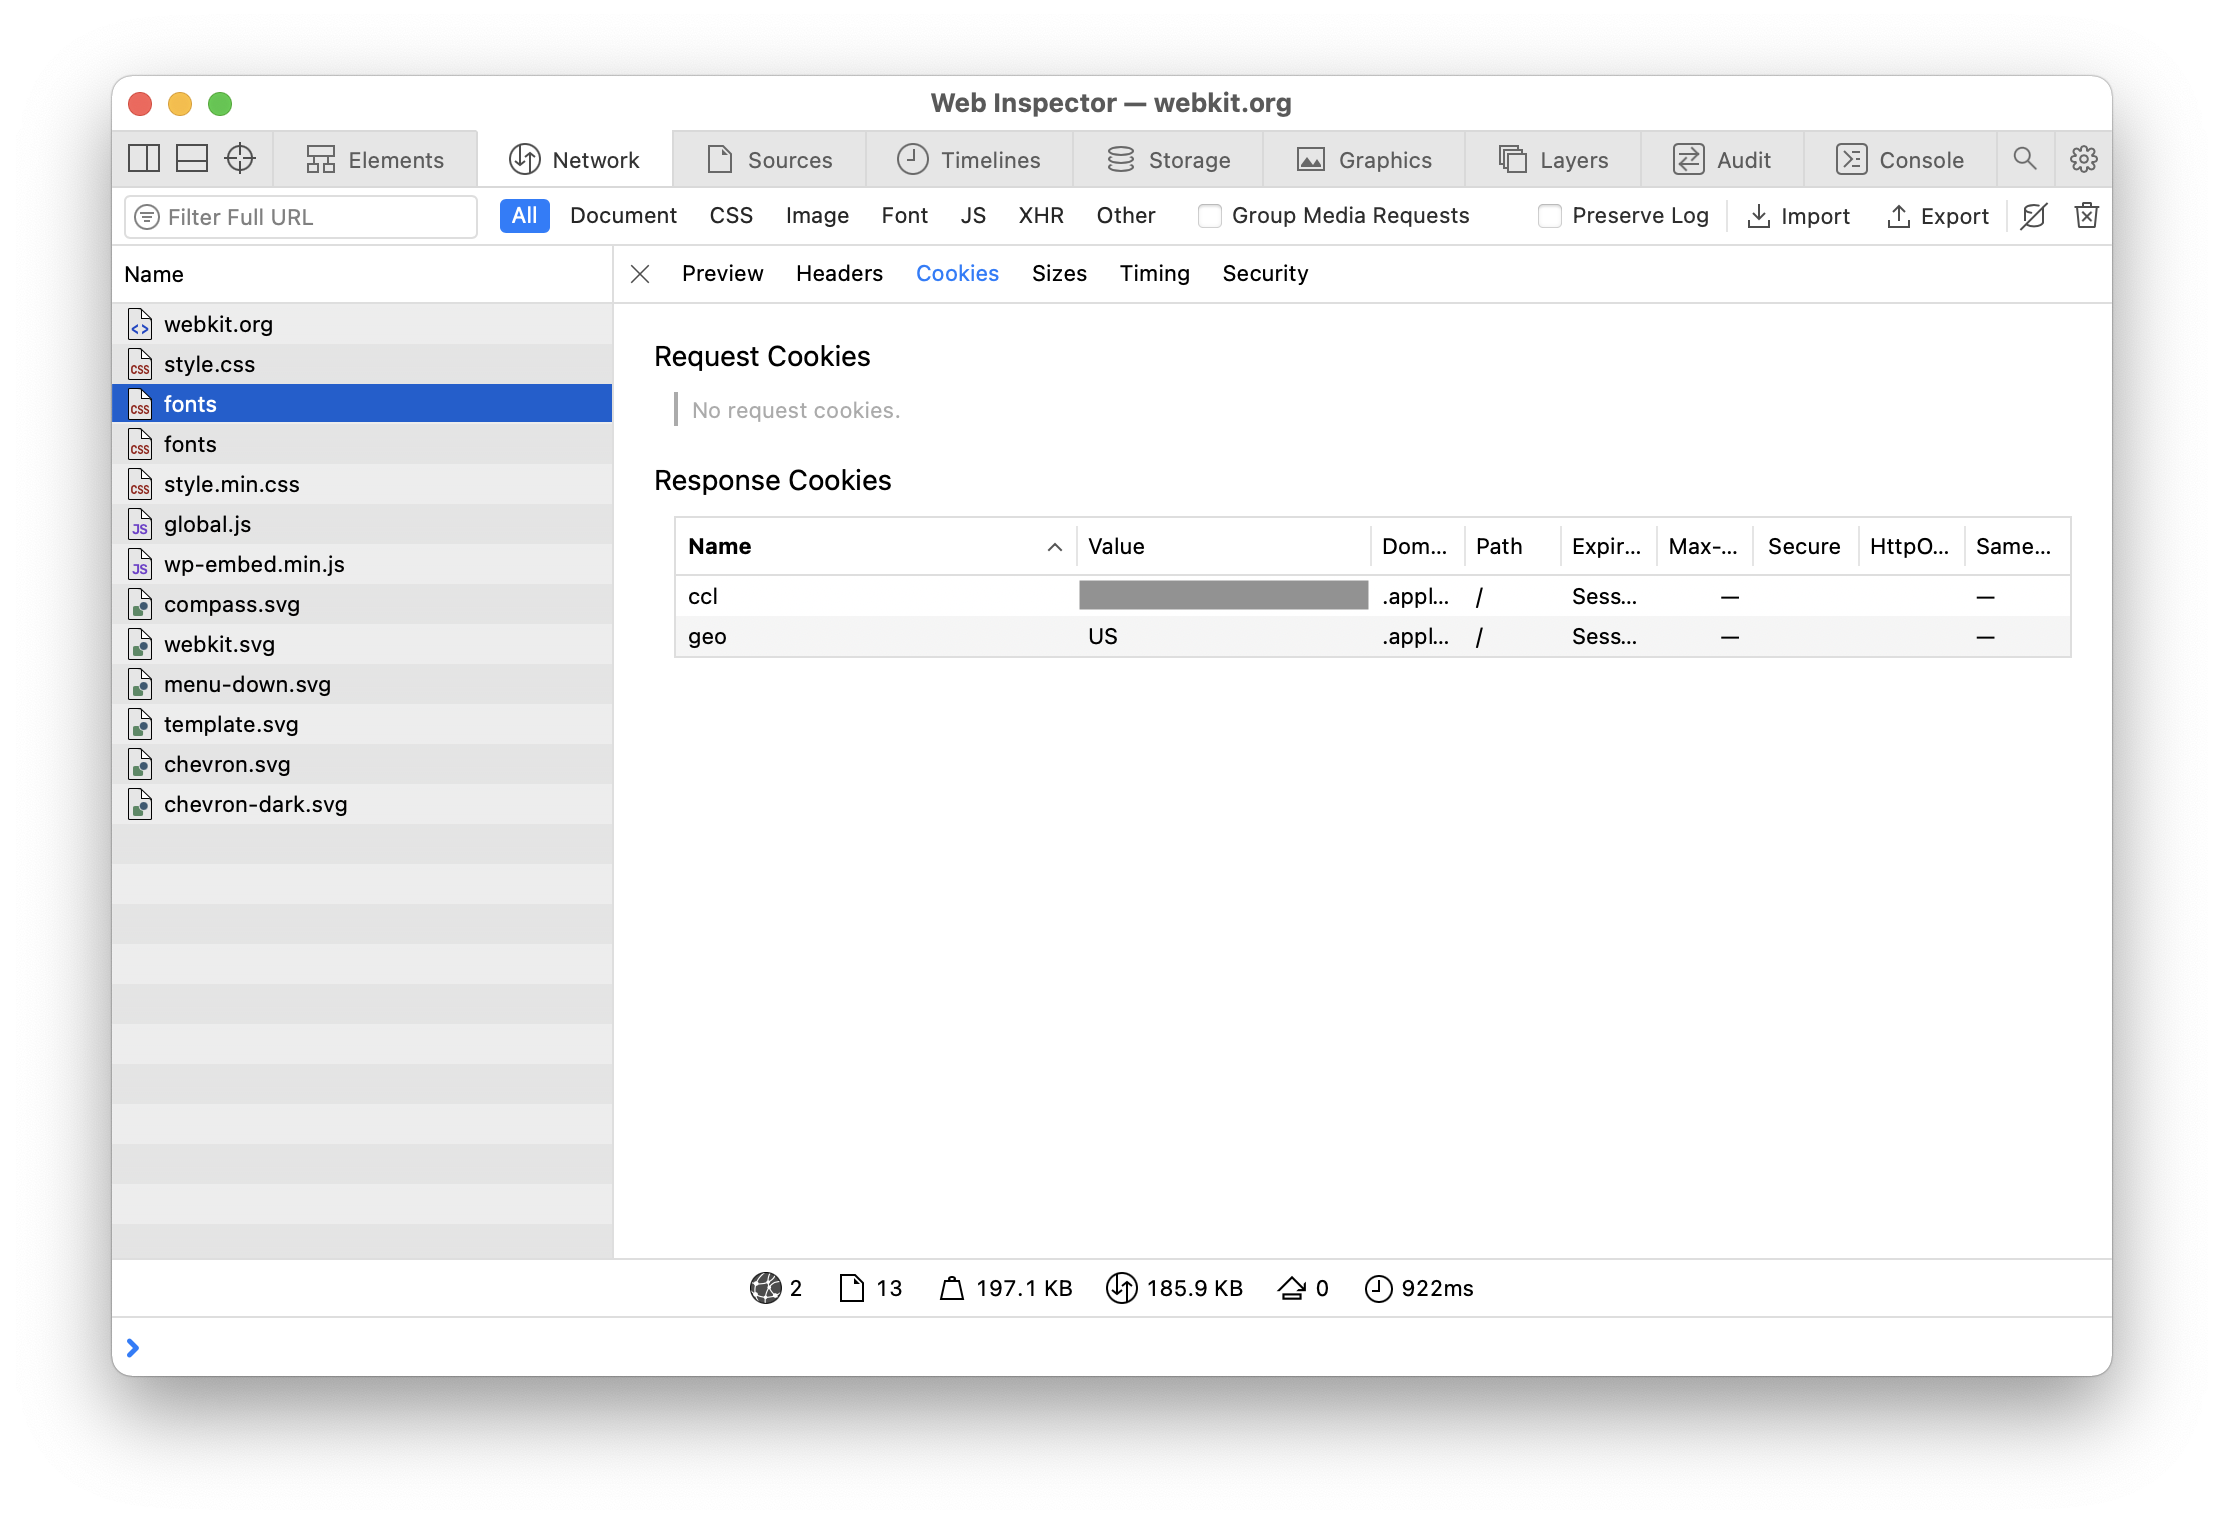
Selecting a resource in the table will show a more dedicated view about that resource, including a number of different panes, each focusing on a particular aspect of that resource.
-
The Preview pane displays the contents of the resource as if it were viewed in the Sources Tab.
-
The Headers pane shows information about the request and response headers, including any redirects.
Resources loaded from JavaScript will also have an
-
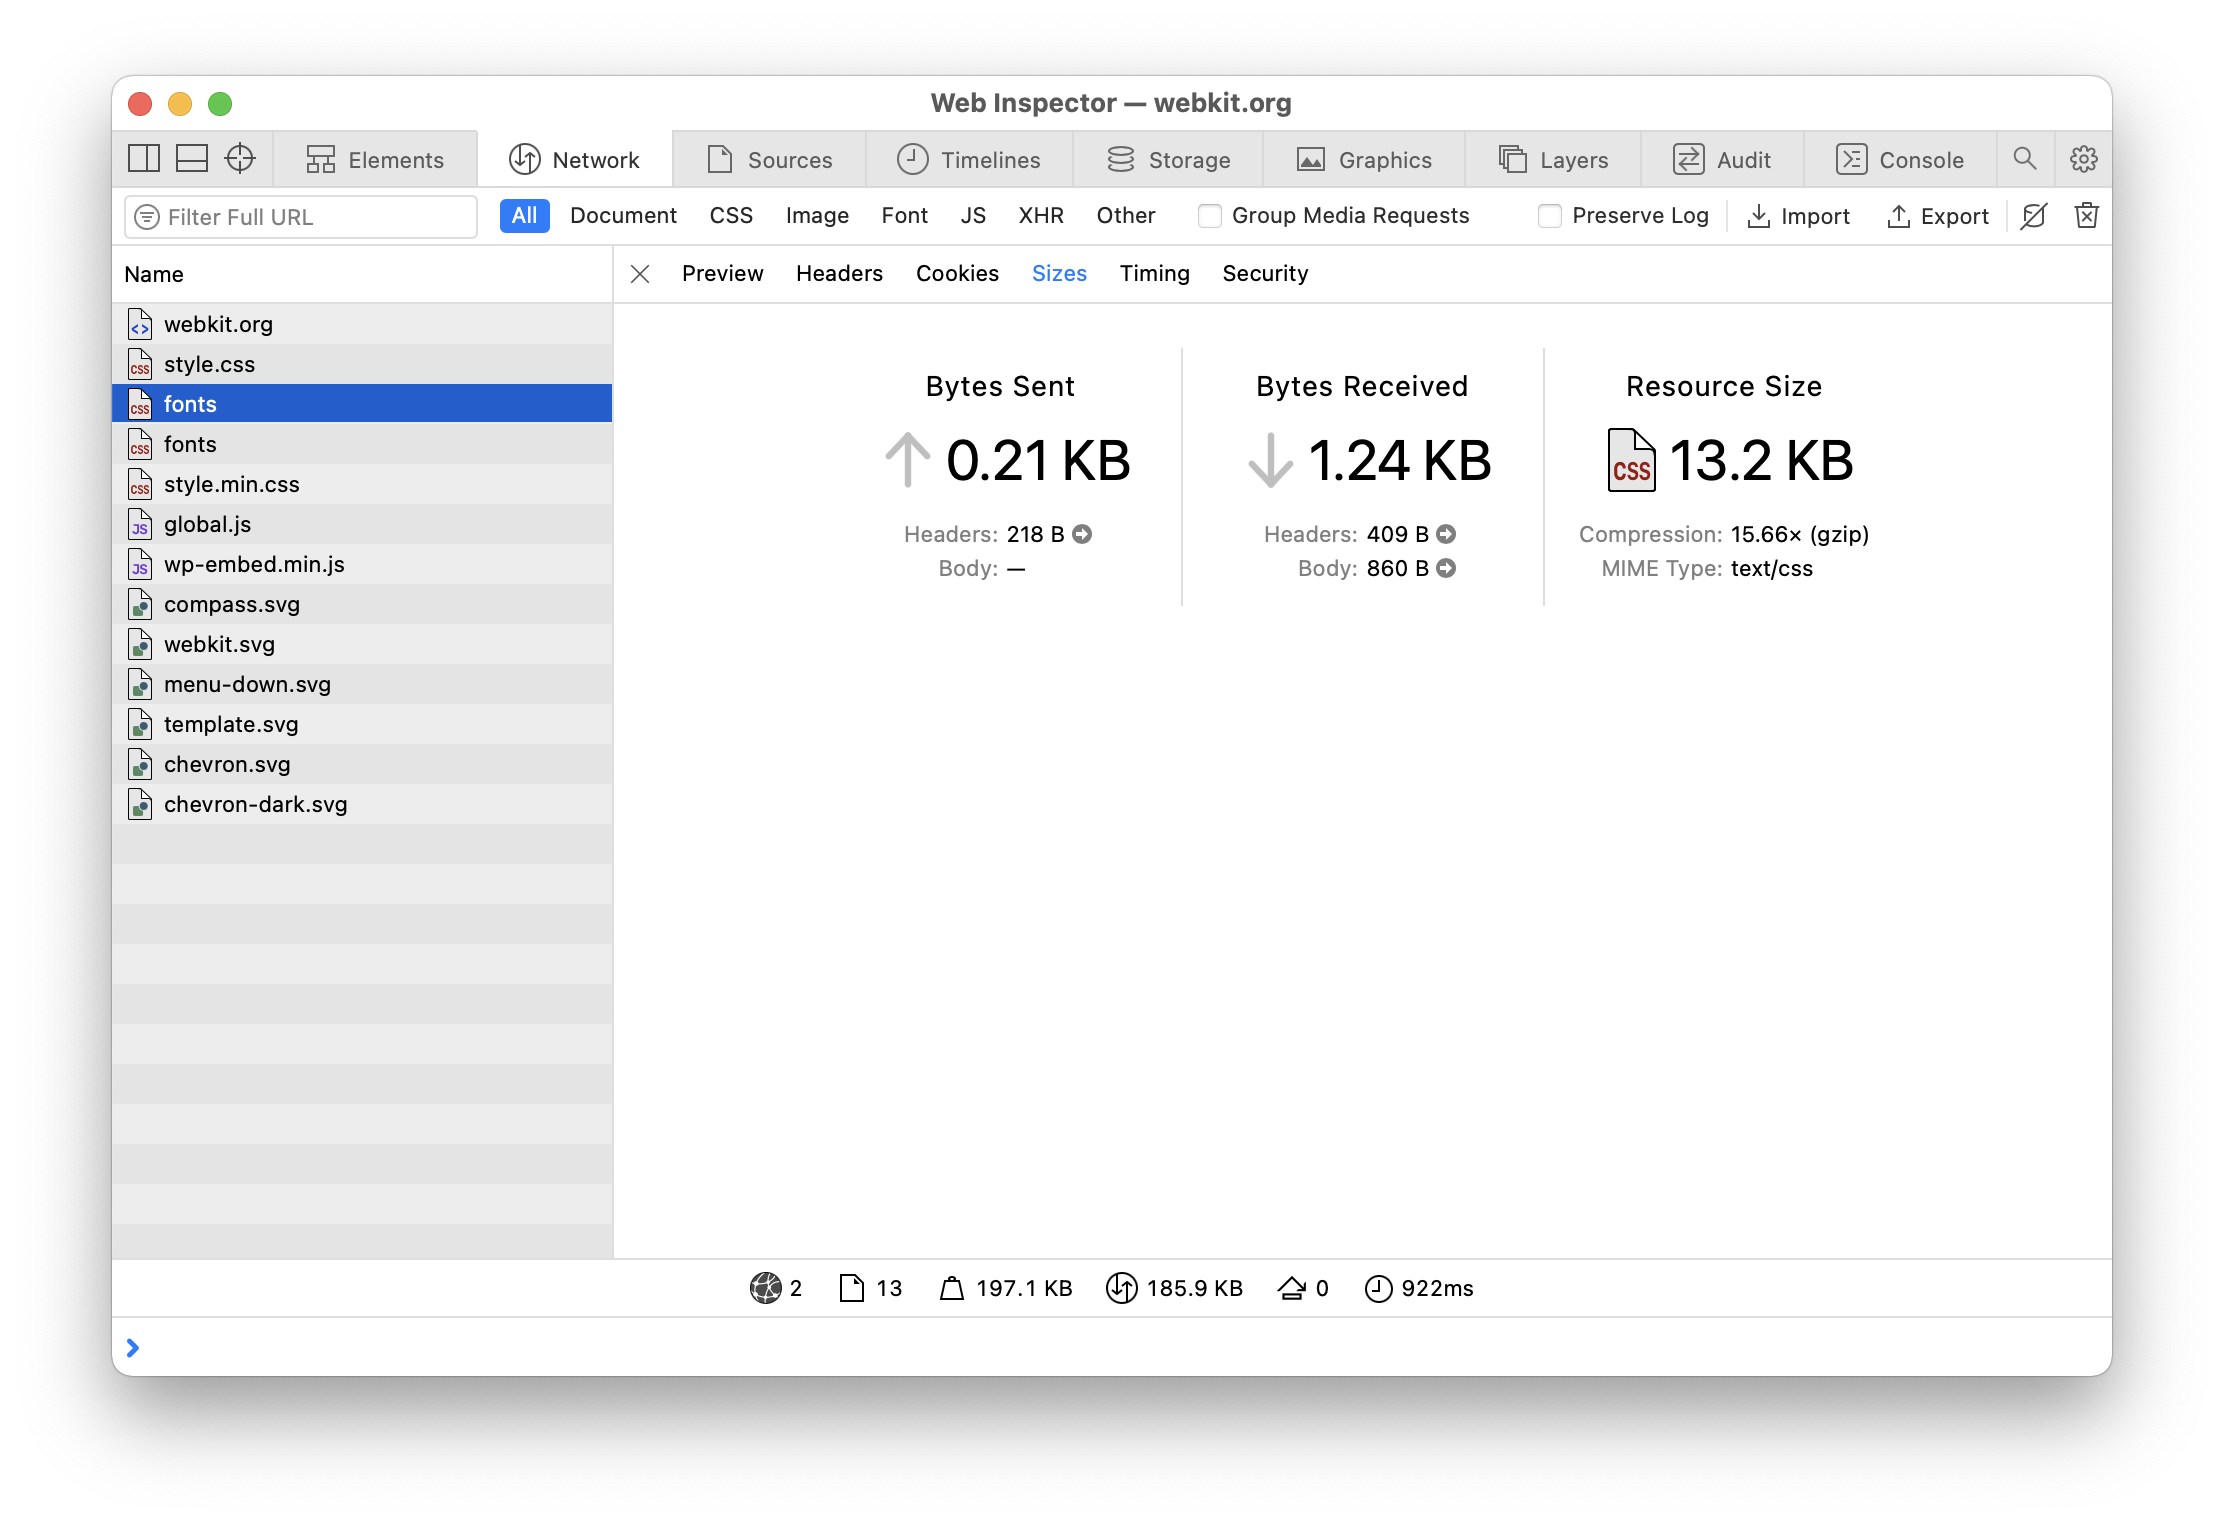
The Sizes pane includes details about the sizes of the various payloads involved with the request.
-
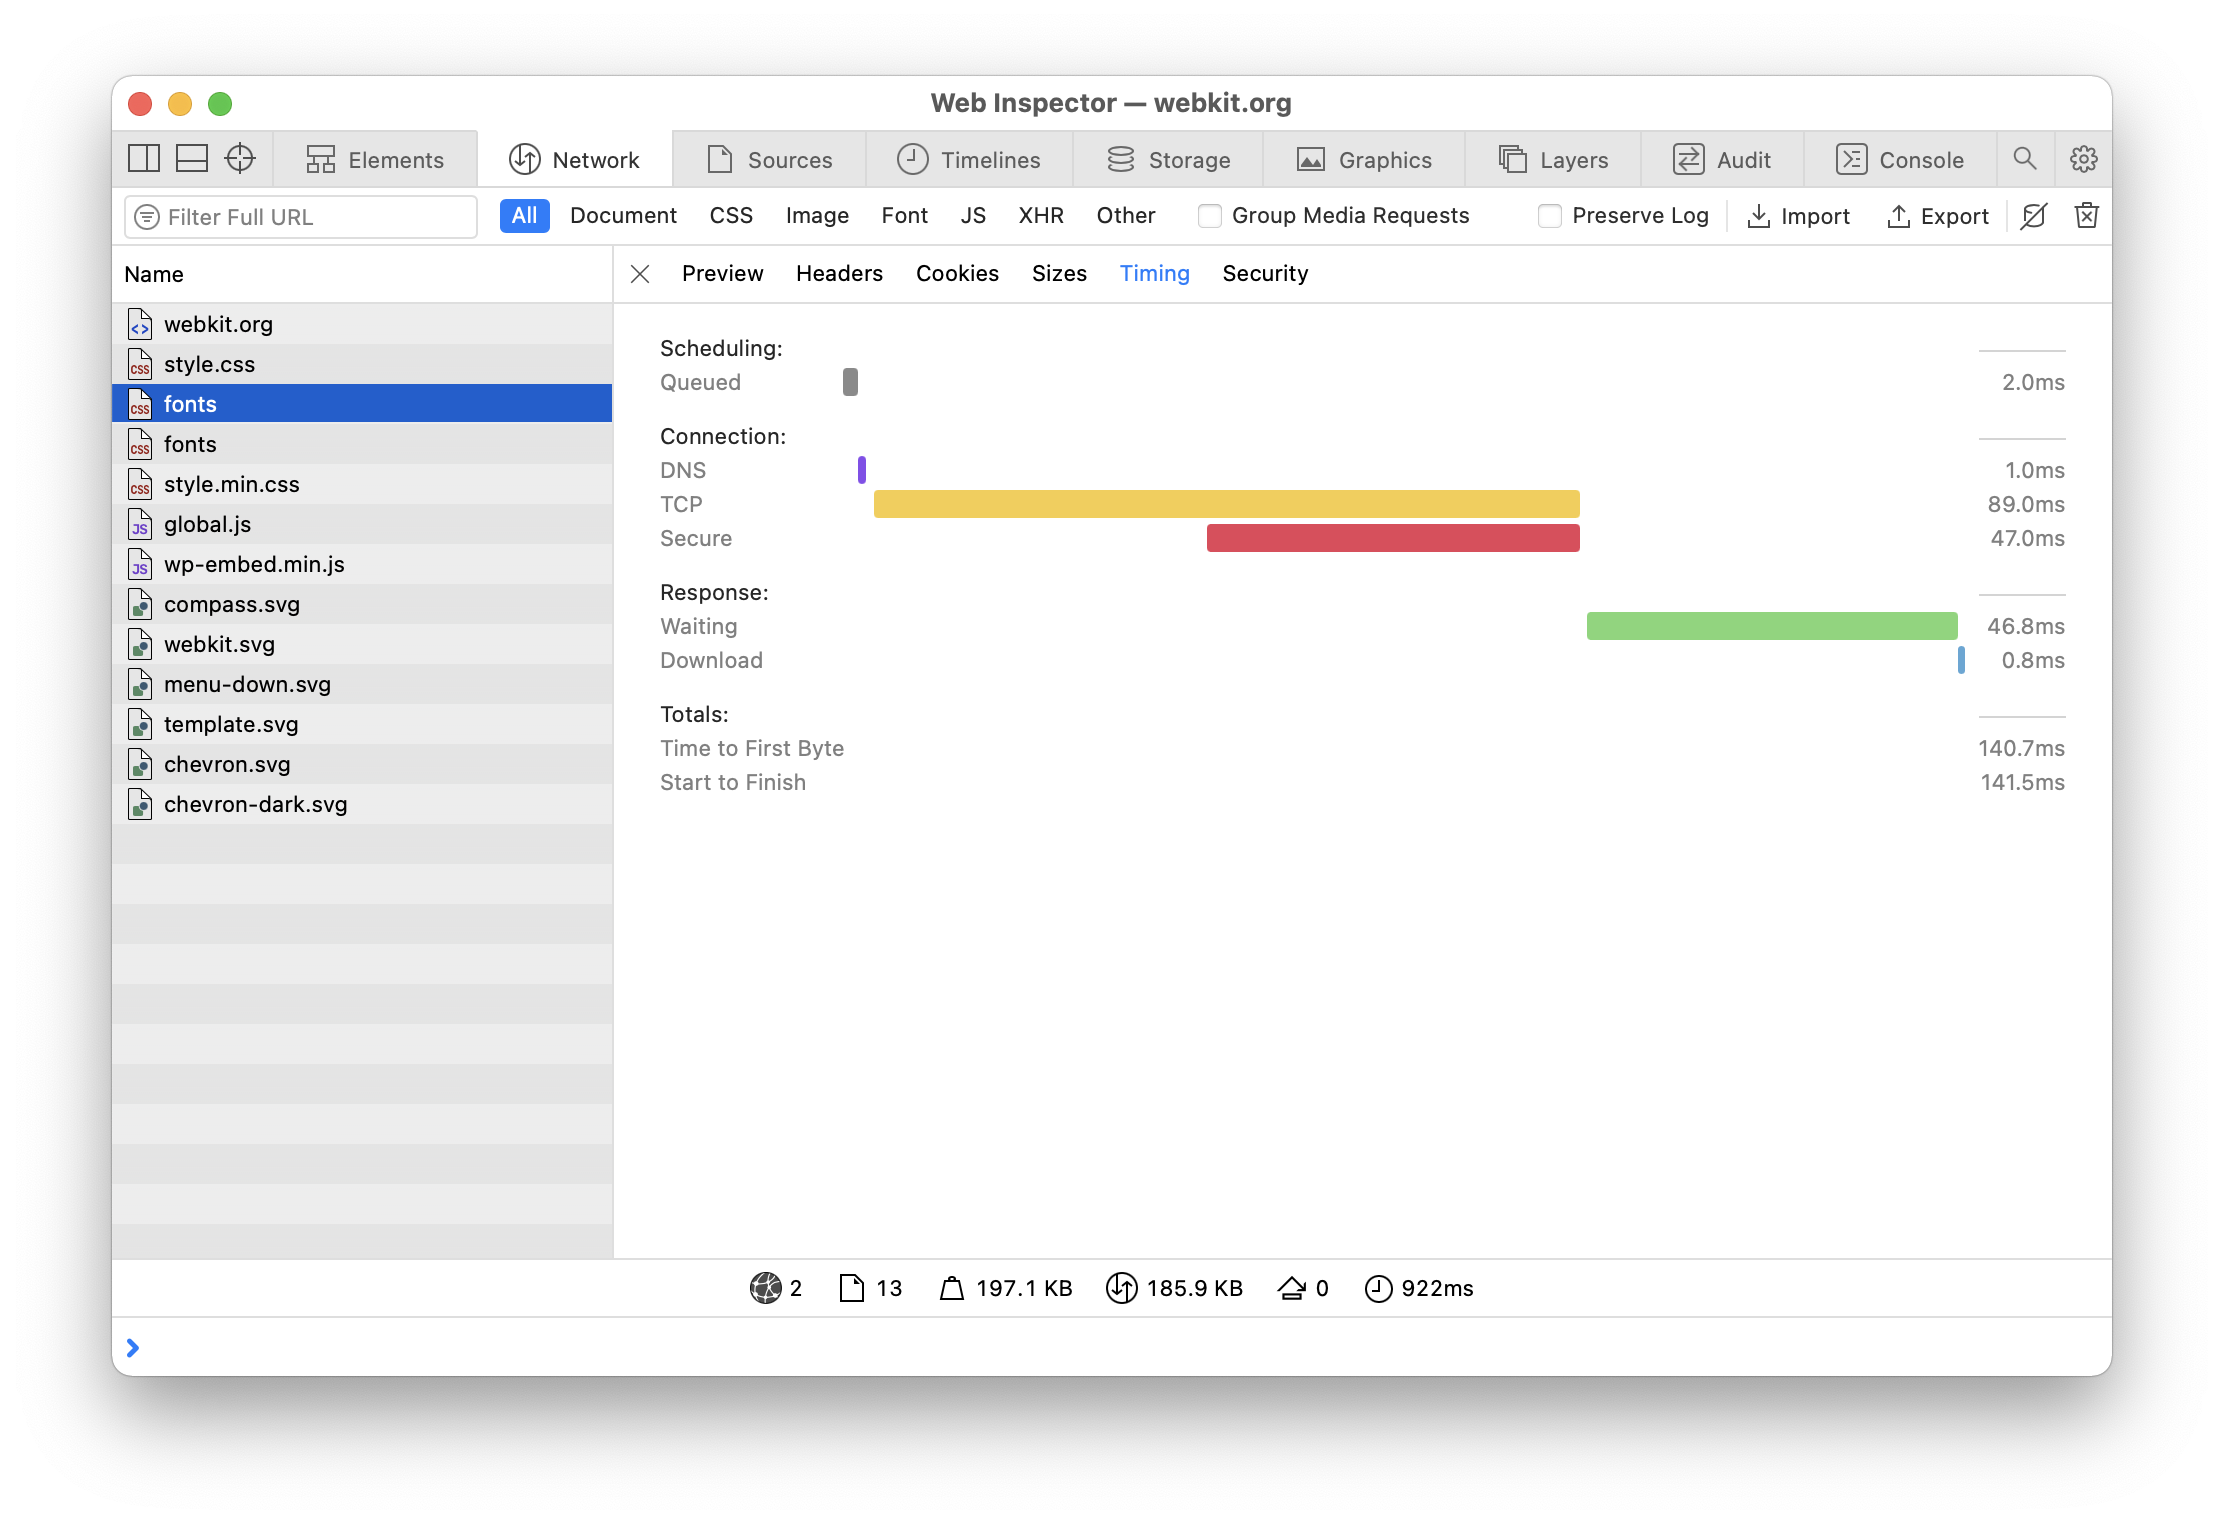
The Timing pane graphs a resource timing data of the selected resource, broken down into distinct phases.
This information is also shown in a popover when clicking on the activity bars of any resource in the Waterfall column of the table.
-
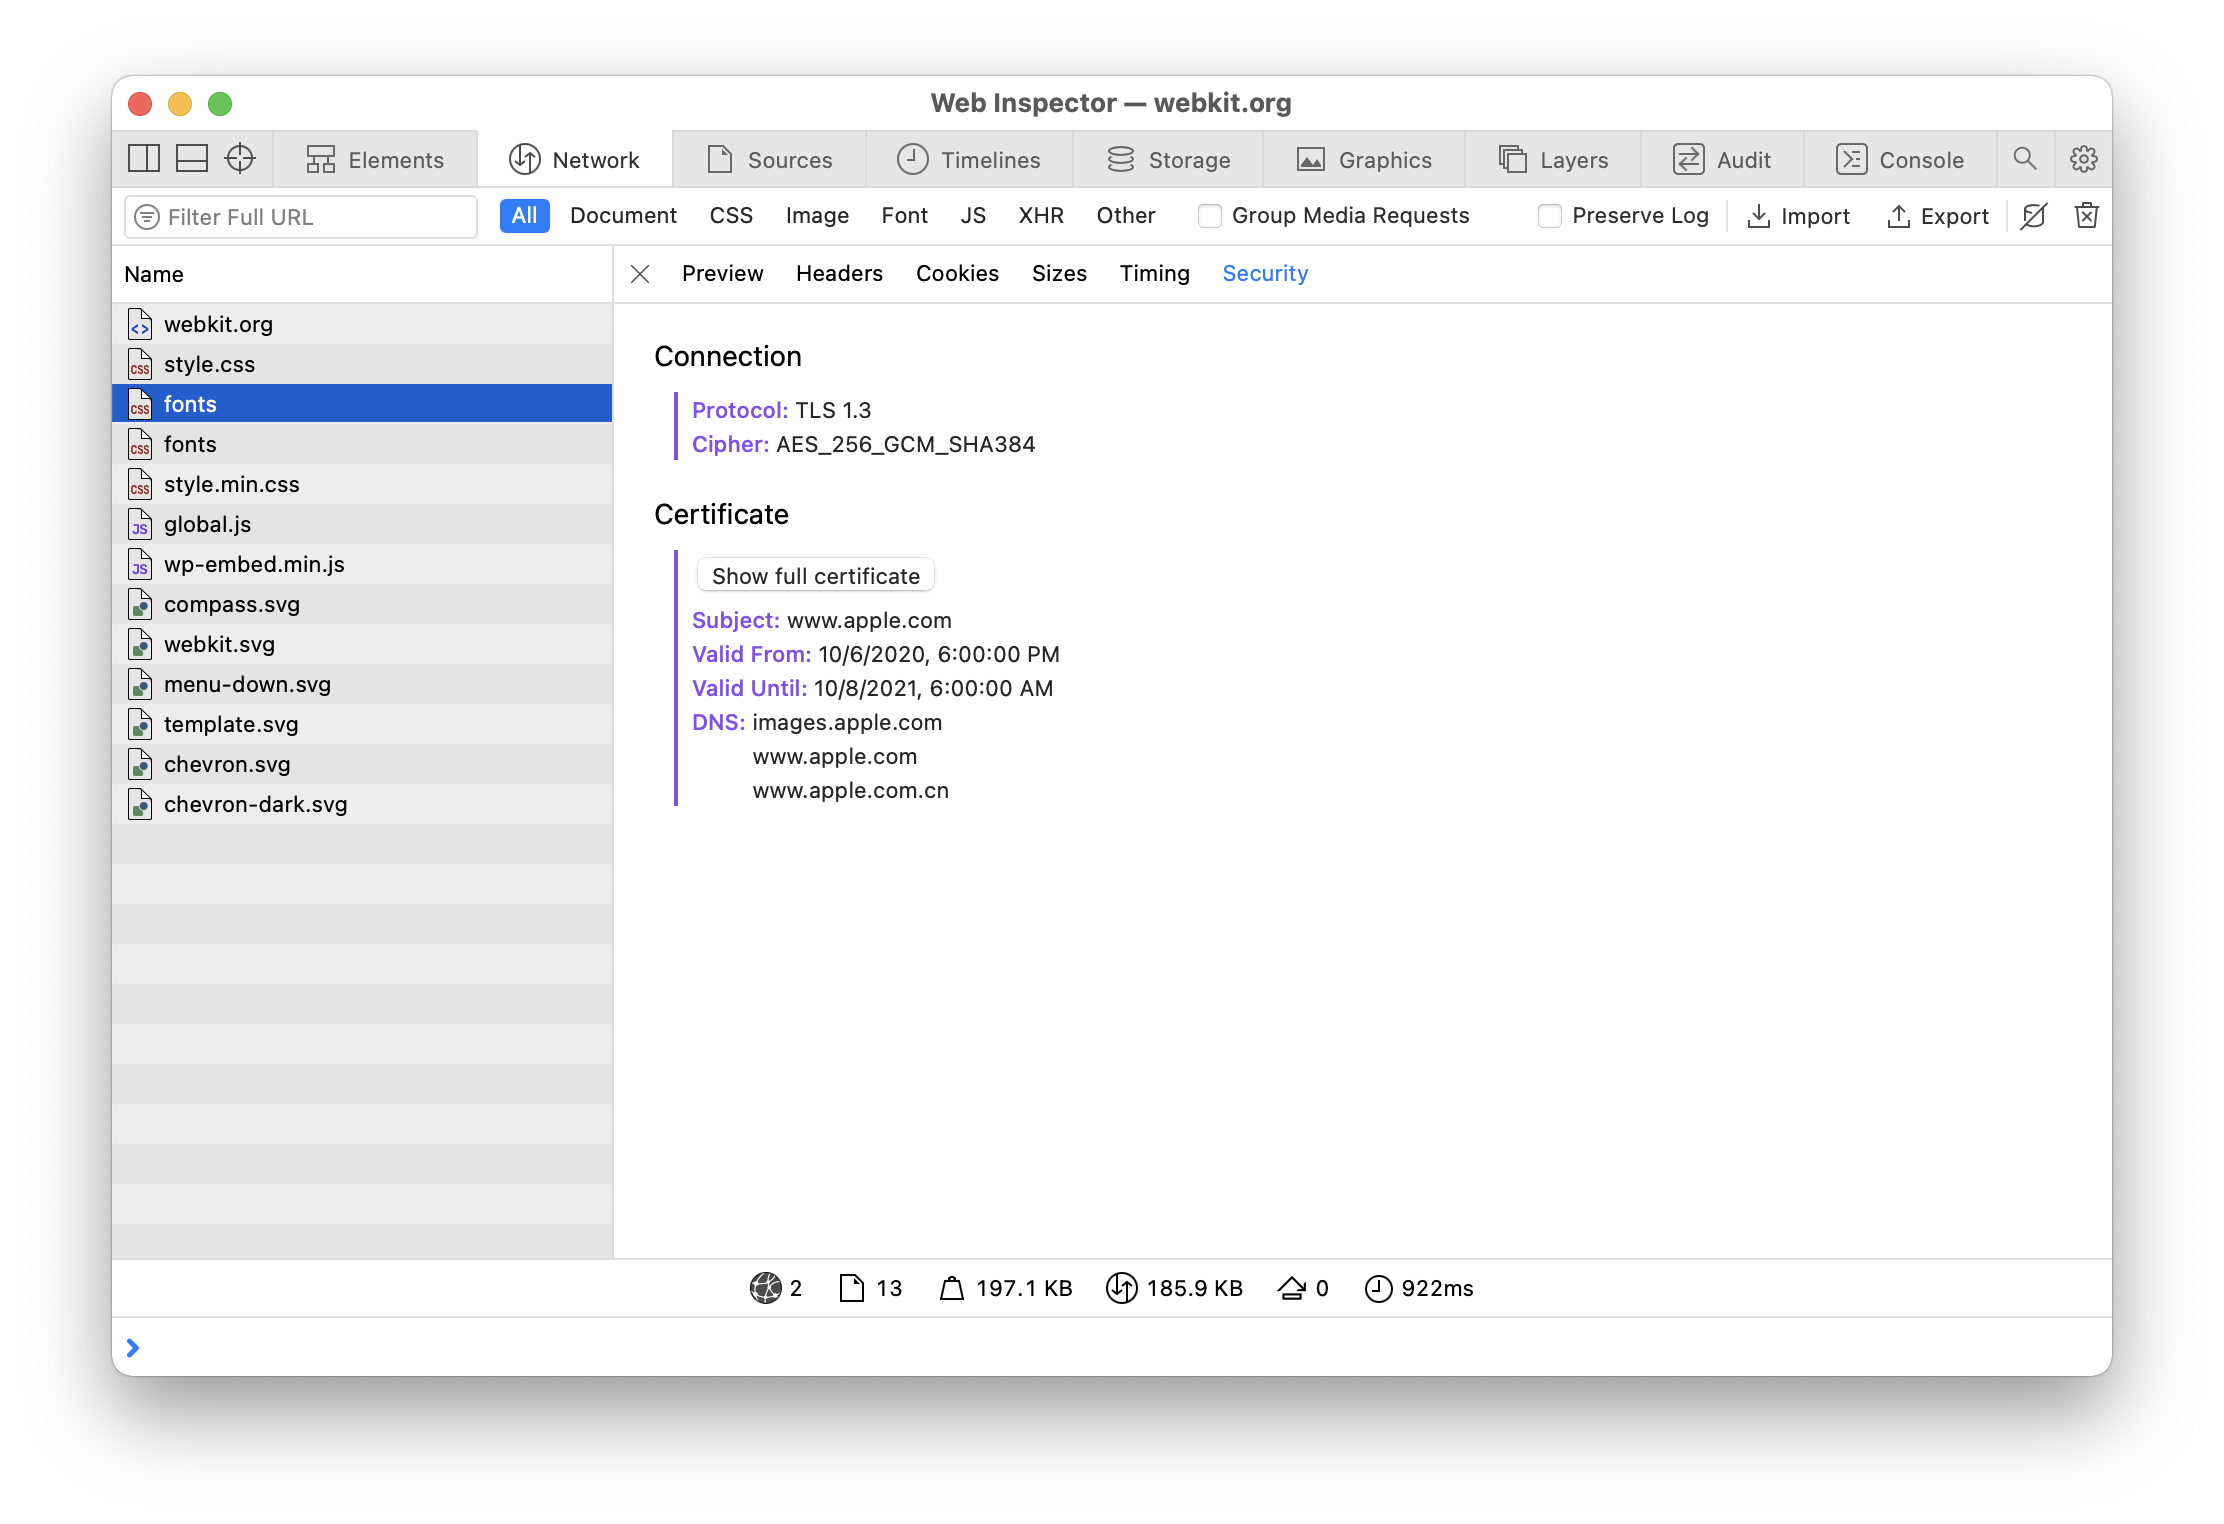
The Security pane provides details about the security of the connection and certificate used to fetch the resource.
Sharing
To export data in the table into an HTTP Archive (HAR) file, click ⌘ S. To import previously exported HAR files, click
Controlling Resource Caching
Caching can sometimes get in the way of developing websites as it can prevent changes made to resources from taking effect as the previously cached version is used instead. The





 Updated for