Web Inspector ReferenceTimelines Tab
The Timelines Tab contains all of the performance profiling and introspection tools provided by Web Inspector, organized into different timelines each with their own area of interest and specialized interface.
Timeline recordings can be started, stopped, or resumed via the space in the Timelines Tab. The current timeline recording can be cleared via the ⌘ K.
Resuming after having stopped will add any newly recorded activity to the end of the previously active timeline recording. Shift-clicking ⇧ space will start a brand new timeline recording, completely separate from all other existing timeline recordings. The active timeline recording can be changed using the breadcrumbs at the top of the Main Content Area.
A new timeline recording is automatically created whenever the inspected page navigates if the Timelines Tab is currently active. When the Stop recording once page loads checkbox is checked, this navigation timeline recording will automatically stop:
- after 2s of no recordable activity
- 10s after the
loadevent is fired - 90s after the timeline recording started
Timeline recordings can also be started and stopped via console.profile and console.profileEnd, allowing for the code itself to have more fine grained control over what activity is recorded.
NOTE: JIT deoptimizations, breakpoints, code coverage, type profiler, and other debugging features are temporarily disabled during timeline recordings in order to maximize the performance of the inspected page and therefore measure realistic performance.
Selecting Ranges
The content of the overview graph is able to extend beyond the bounds of the Web Inspector window. Scrolling vertically in the overview graph will zoom the visible time range, adjusting the ratio of the number of pixels used to visualize each second. Clicking and dragging anywhere in the overview graph will adjust the selected time range, which will consequently affect what records are shown, effectively filtering out all other records.

Depending on on the scale of the overview graph, multiple records may be visually merged into a single record.
Clicking and dragging from the top of an existing selected time range will move that time range horizontally without adjusting its total duration. Clicking and dragging either of the start/end handles at the top of an existing selection will extend or collapse that time range without adjusting the other start/end handle.
Clicking on any record in the overview graph will select that record in the associated timeline. If the record is outside of the current selection range, it will be adjusted to include that record with some extra time padding before/after.
Double-clicking anywhere in the overview graph will clear the current selection.
Events View
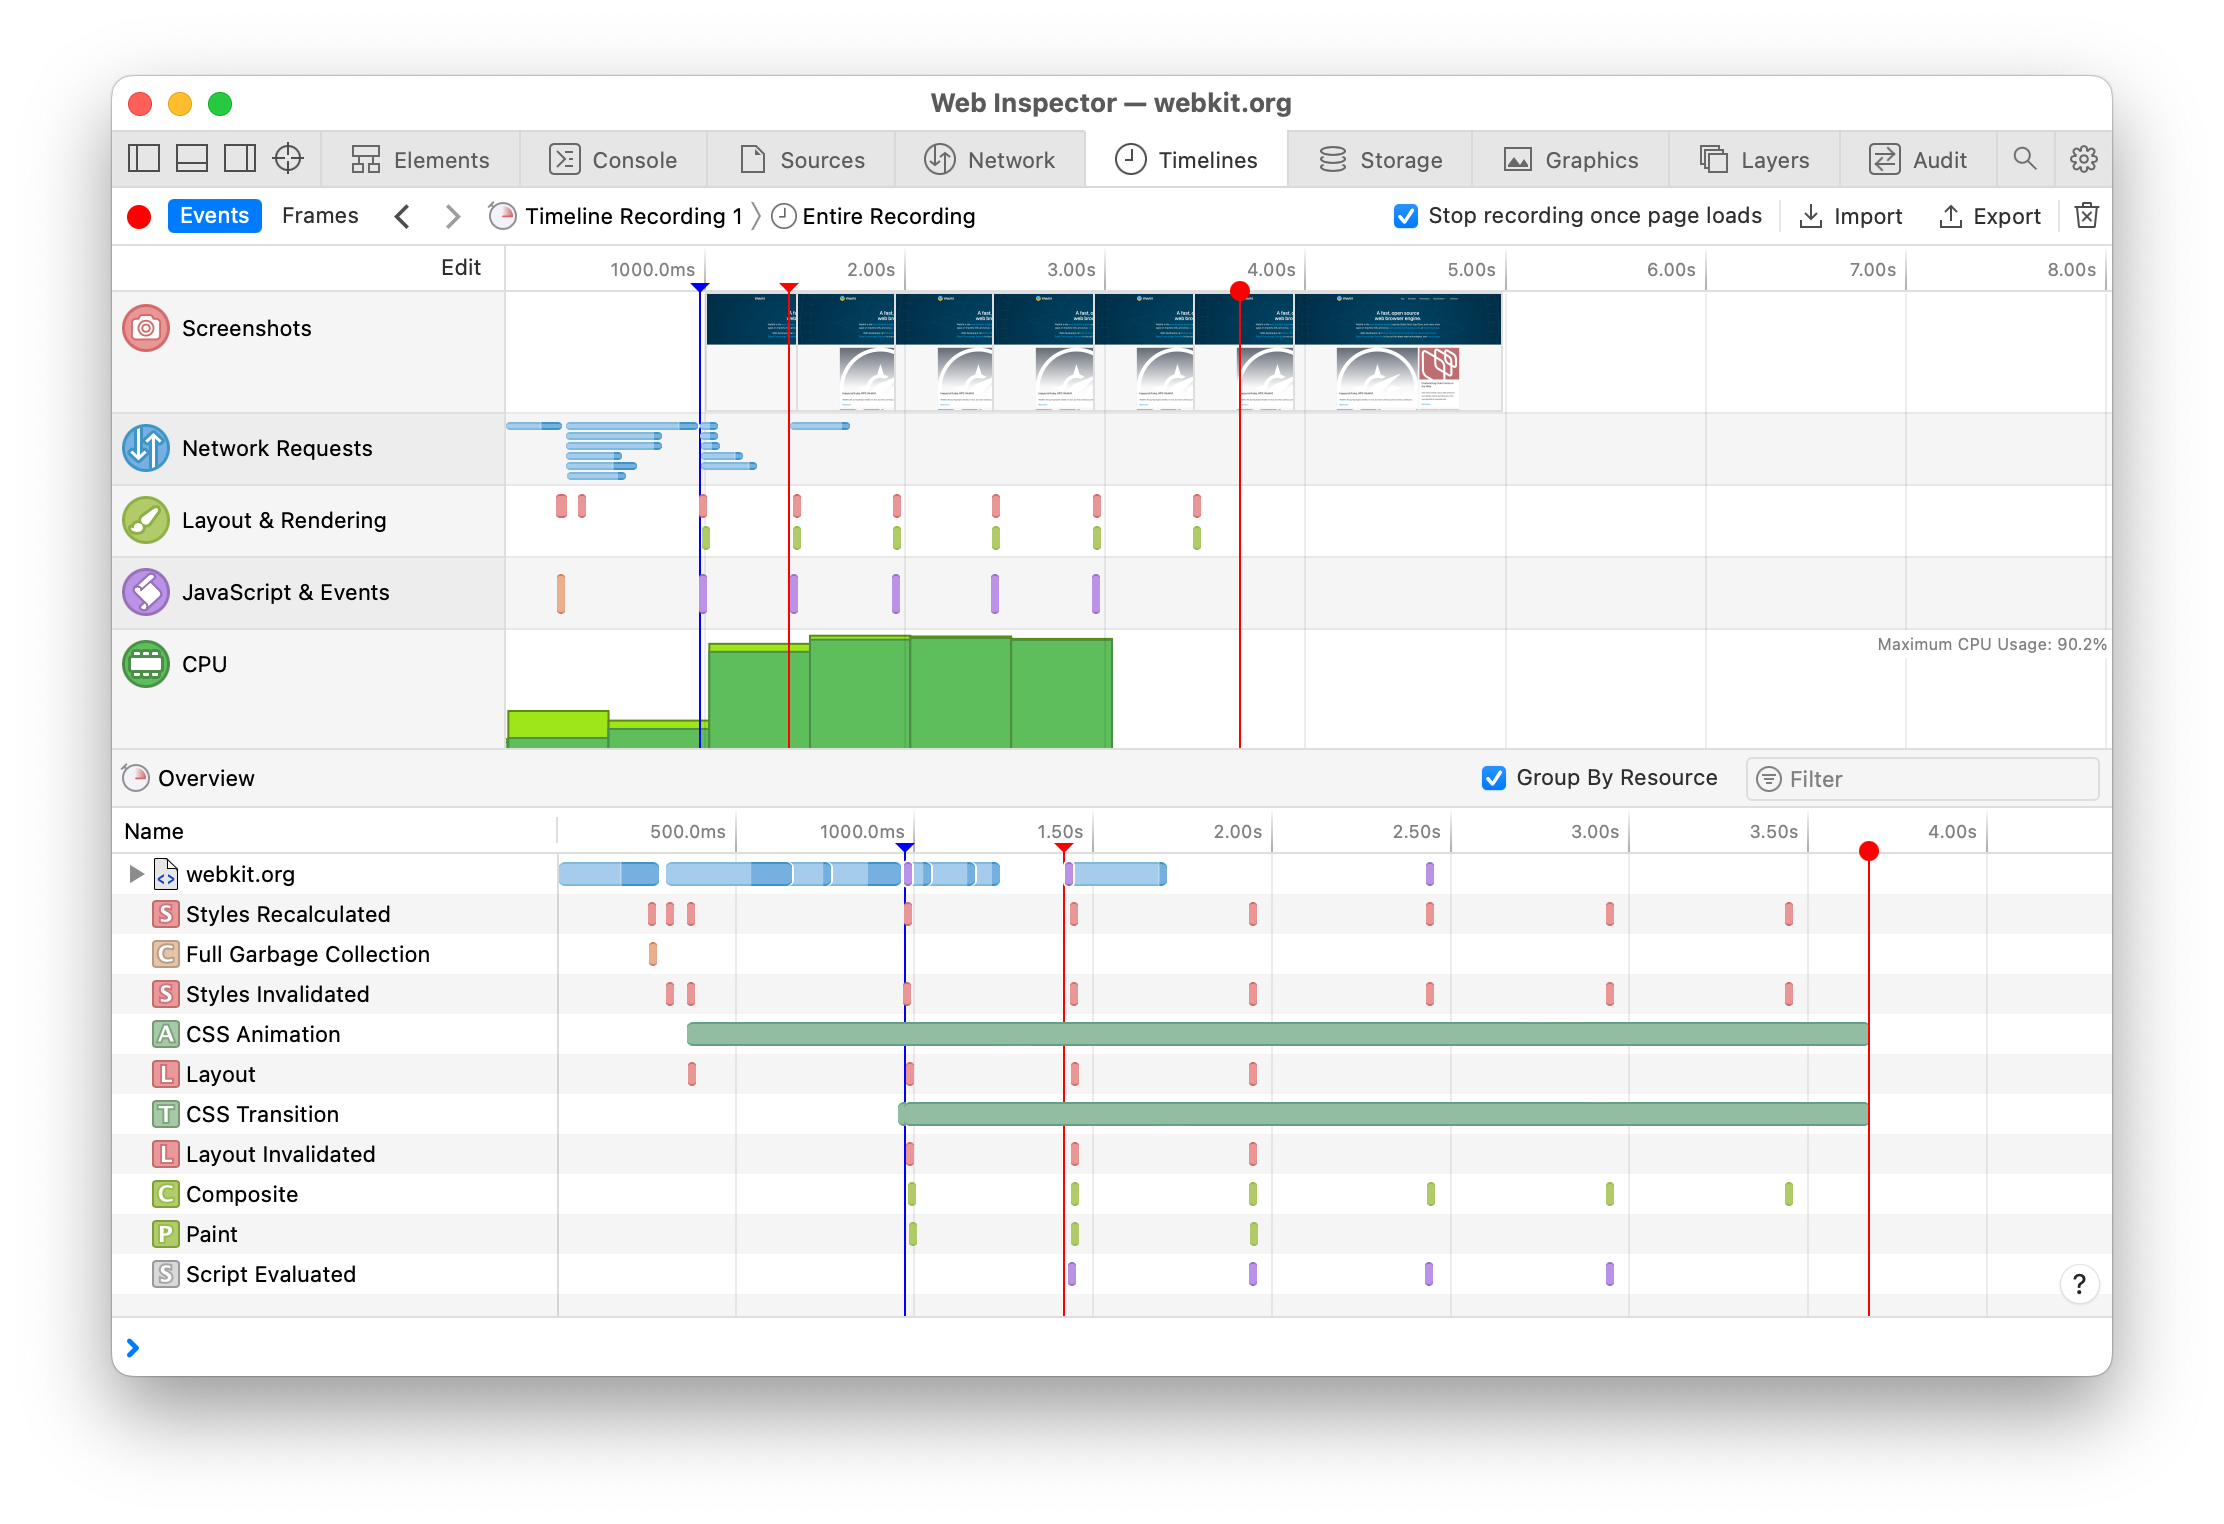
The Events view plots data captured during a timeline recording into a combined overview graph as a series of records, allowing for a quick scan to know when there was activity.
In addition to the record bars, there are different vertical line markers that can appear in the overview graph during a timeline recording to indicate significant or noteworthy events.
- Current time of active timeline recording
-
loadevent dispatched in inspected page -
DOMContentLoadedevent dispatched in inspected page -
console.timeStampwas called - Scanner line that projects a time in the selected timeline onto the overview graph
If the Group By Resource checkbox is checked, records are organized by either the originating resource or the type of activity rather than each having their own row in the overview table.
The Events view contains a number of different timelines that group similar activity together. Timelines can be disabled by clicking on the Edit button above the list of timelines and unchecking the checkbox next to that timeline.
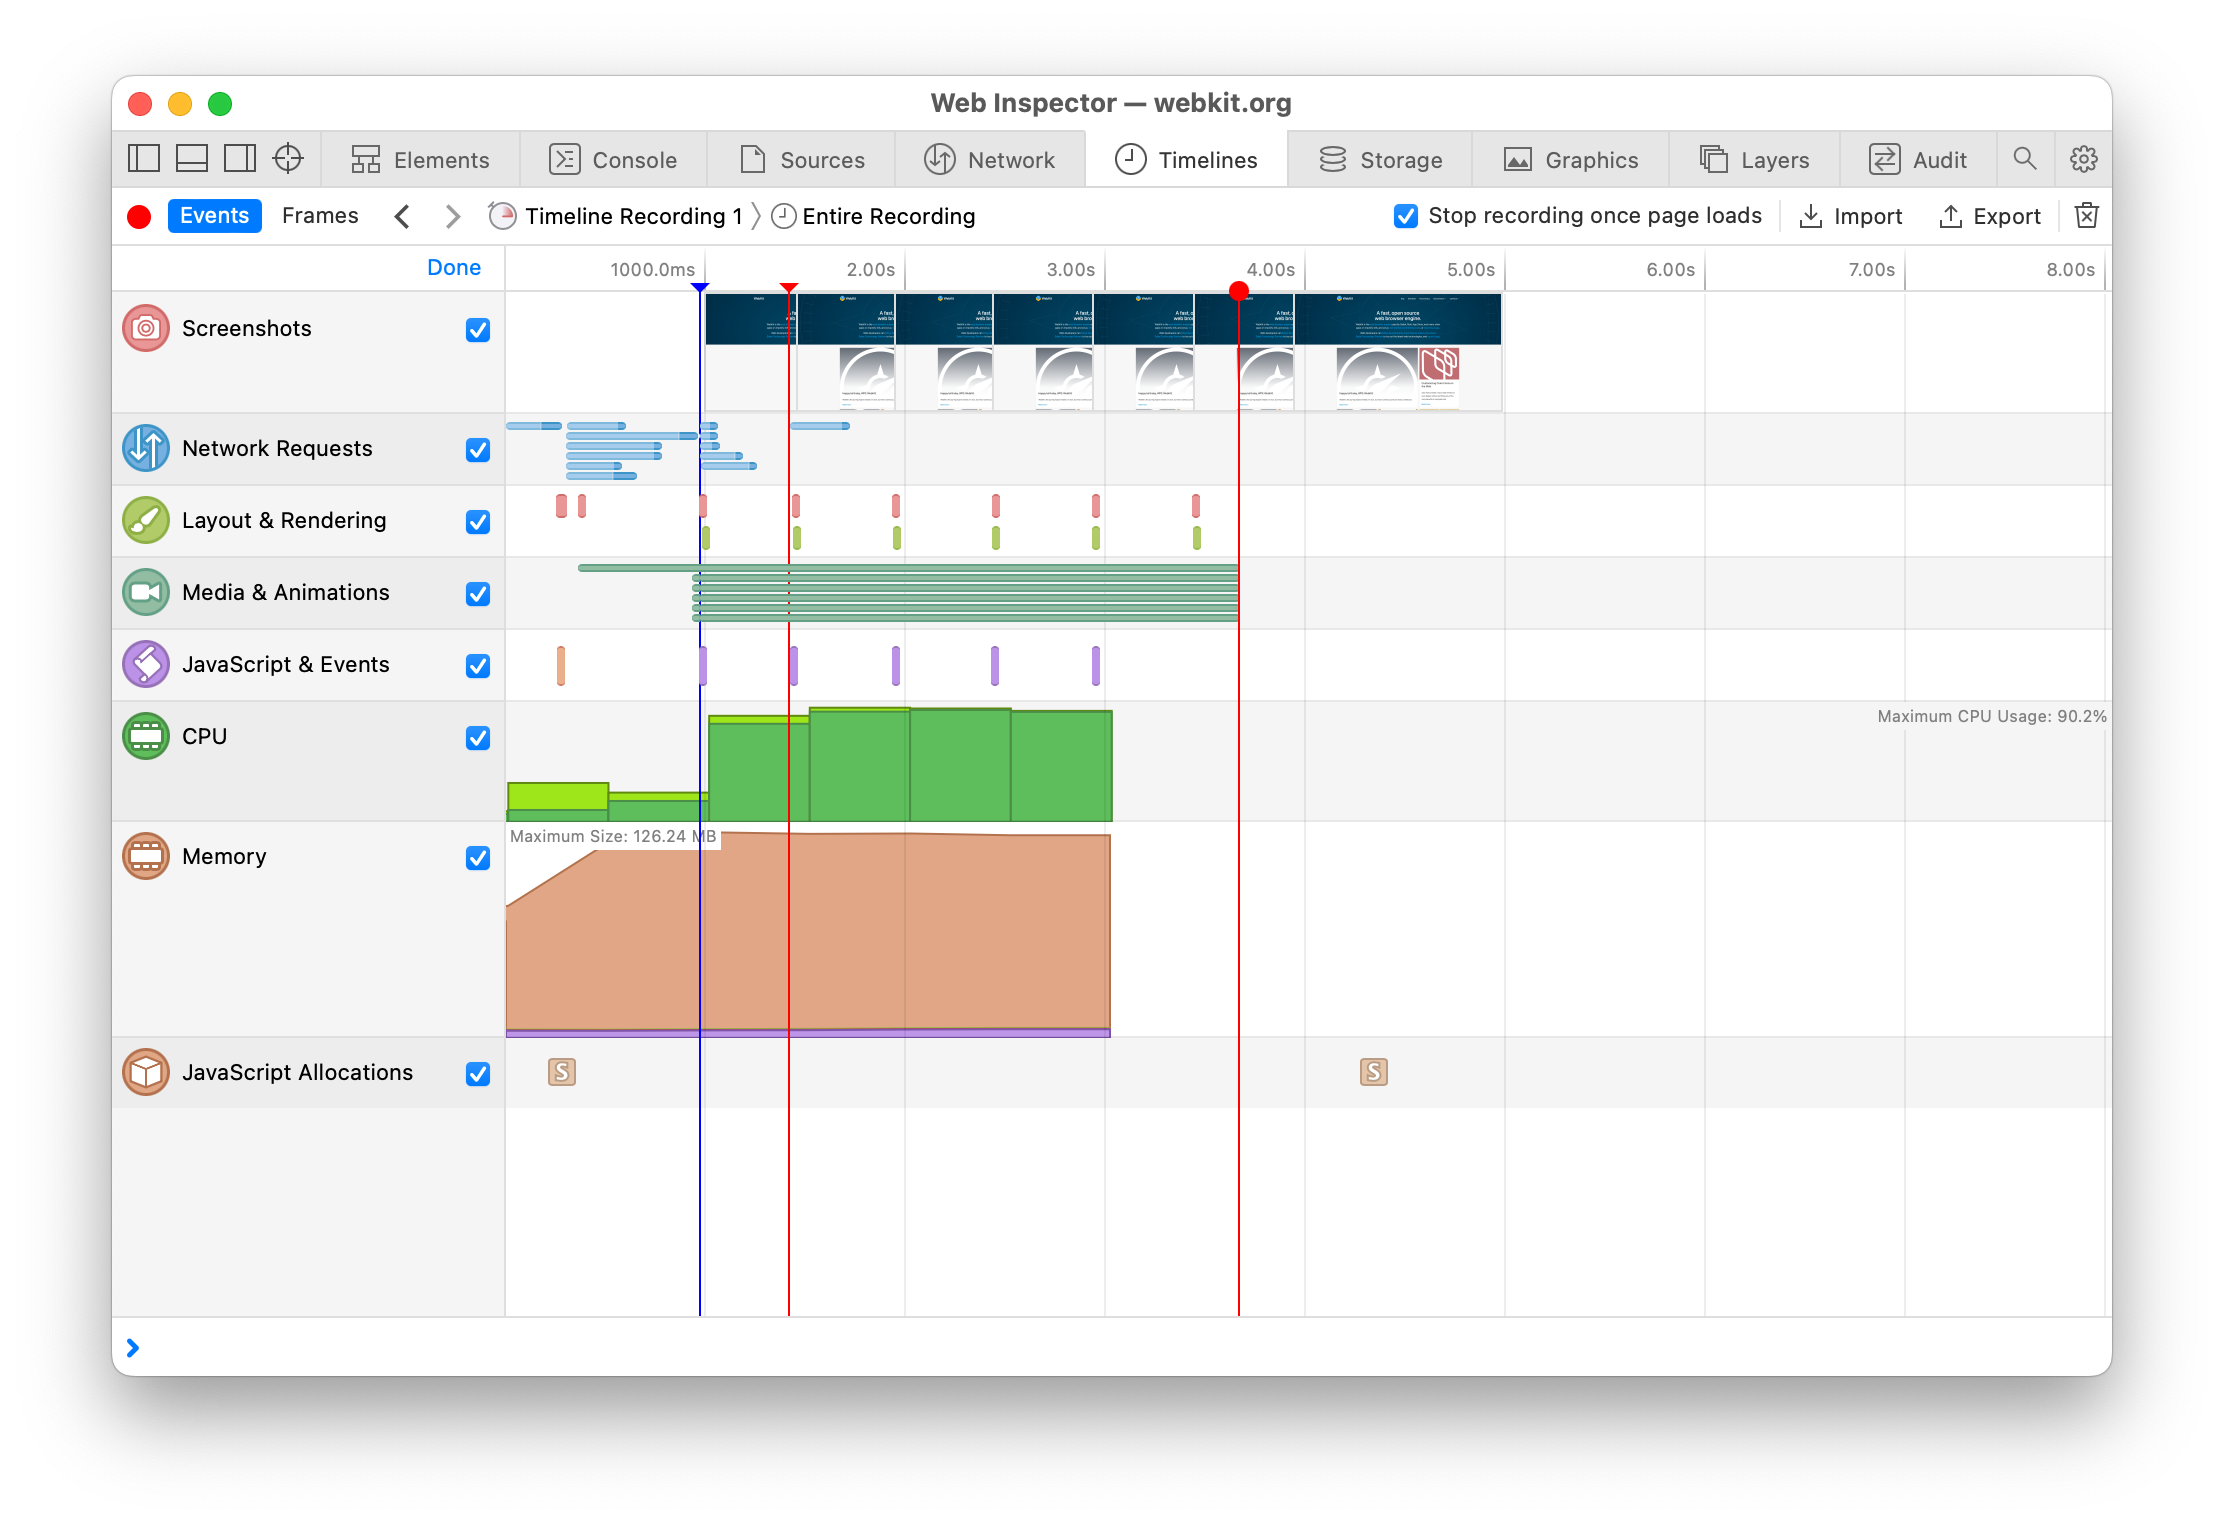
The disabled state of each timeline is preserved across Web Inspector sessions.
Selecting any one of these timelines will show a more specific and detailed view for the type(s) of activity it represents.
-
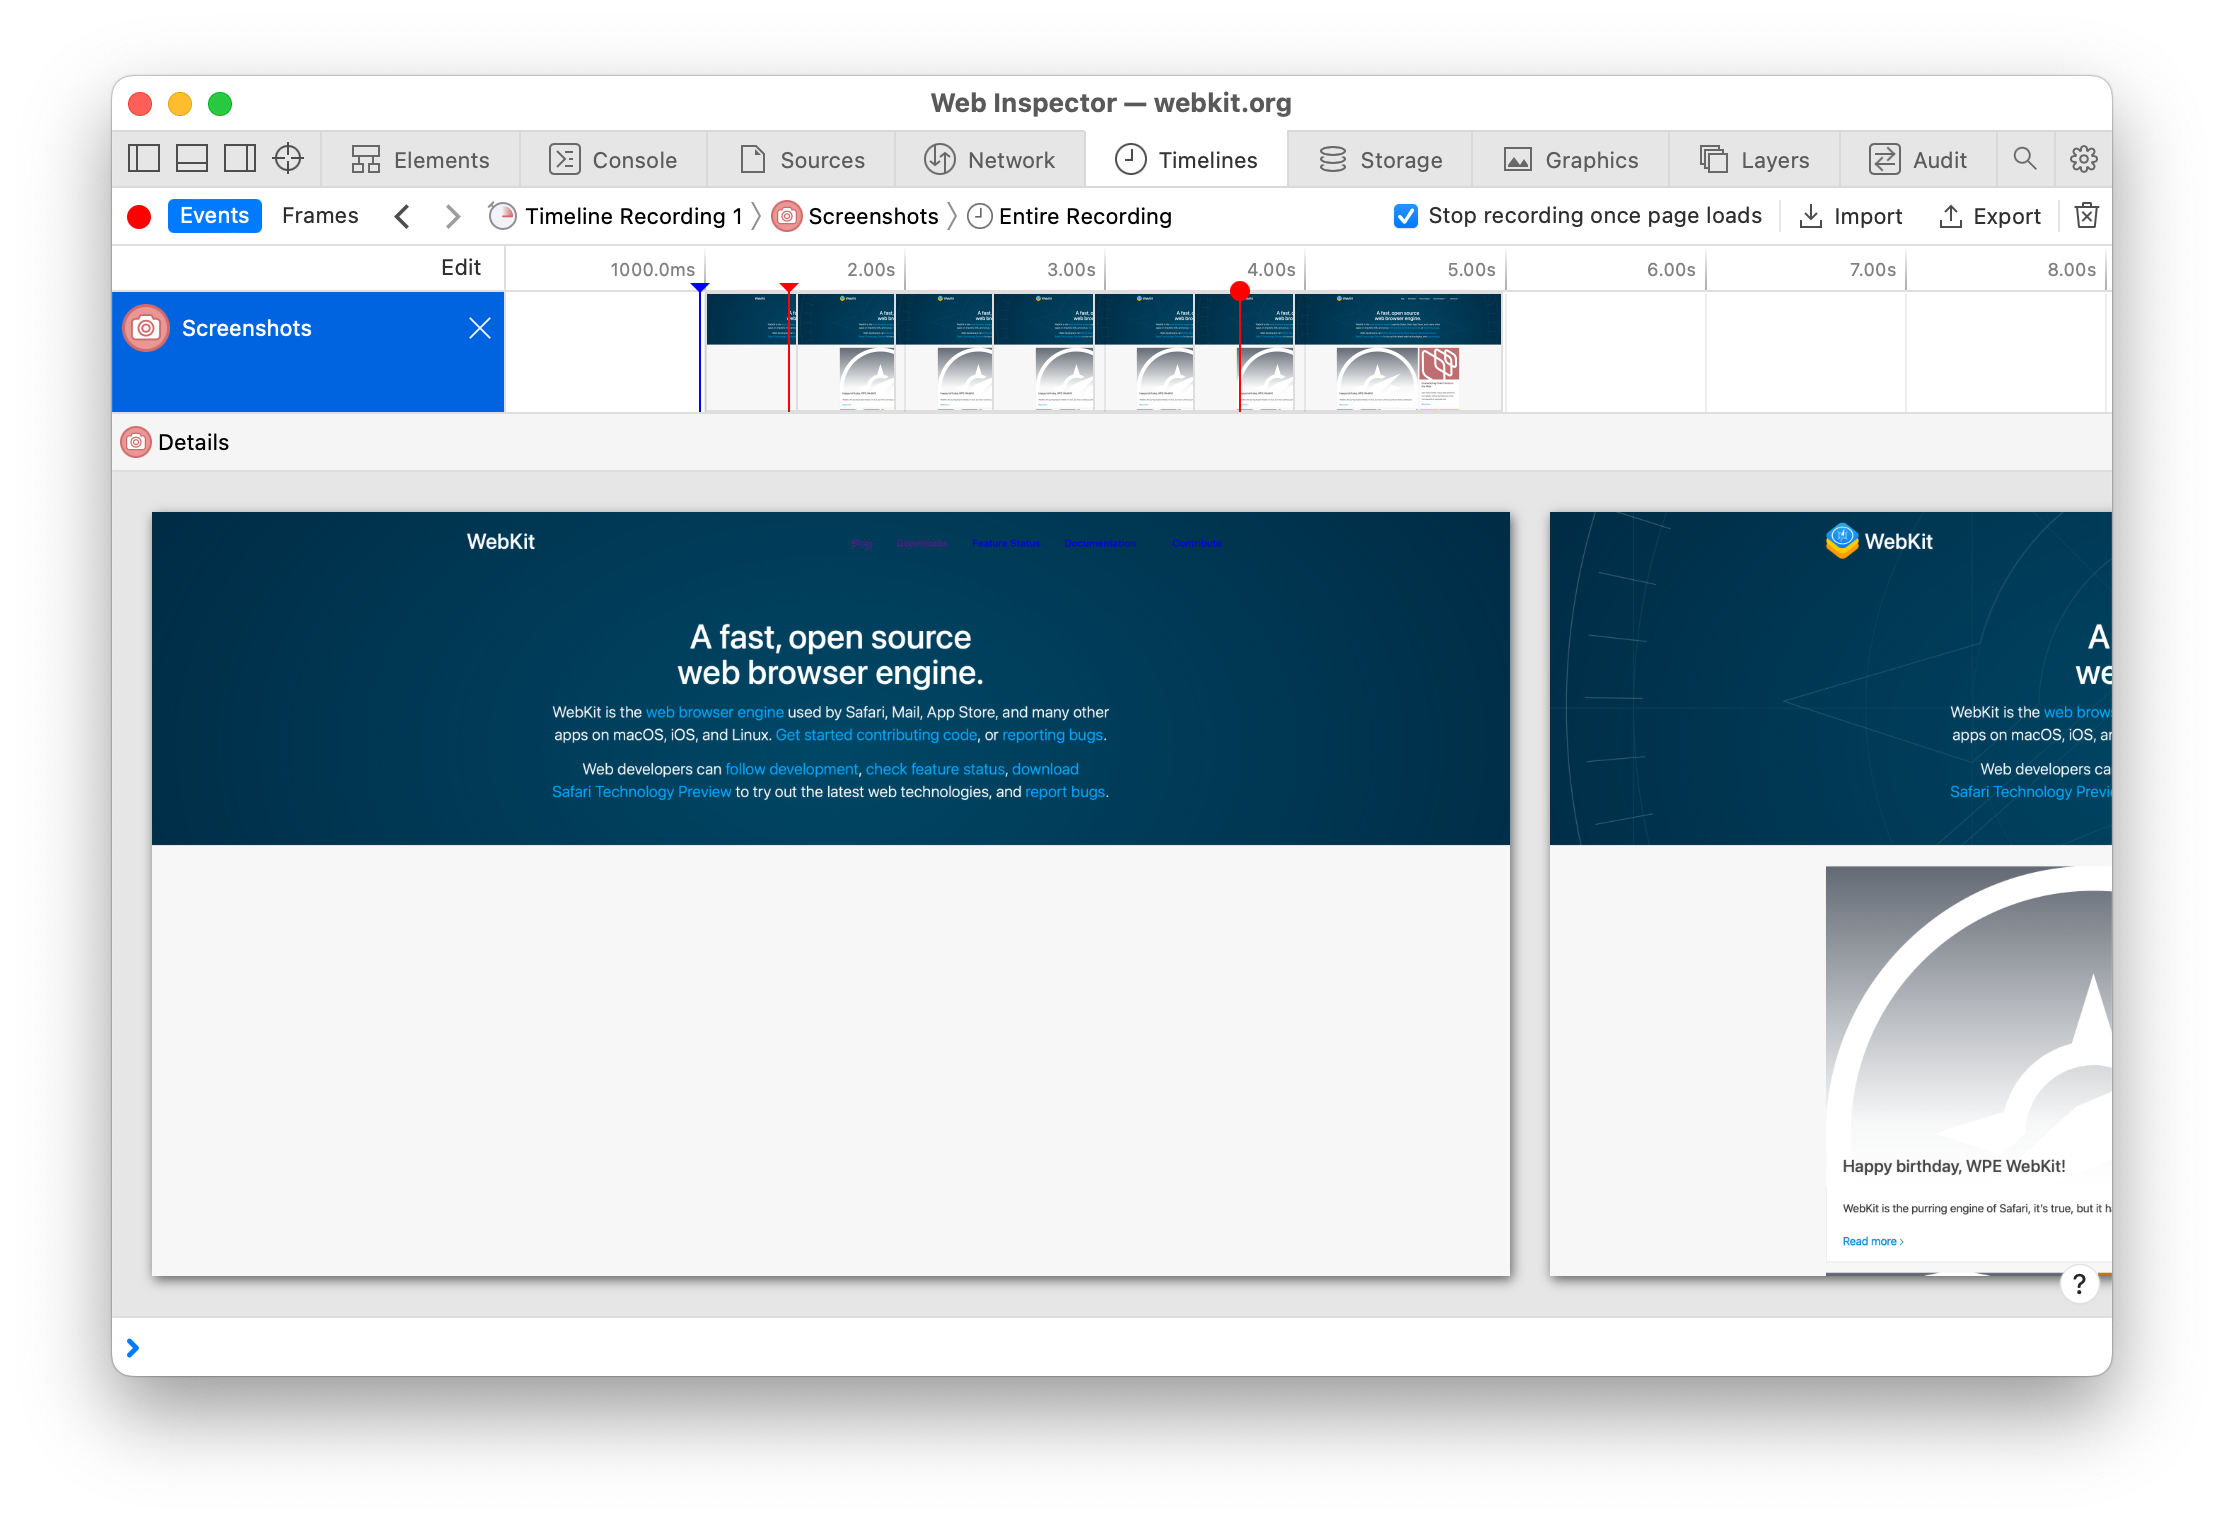
The Screenshots timeline captures a screenshot of the viewport after every composite during the timeline recording, and also shows all images from
console.screenshot. -
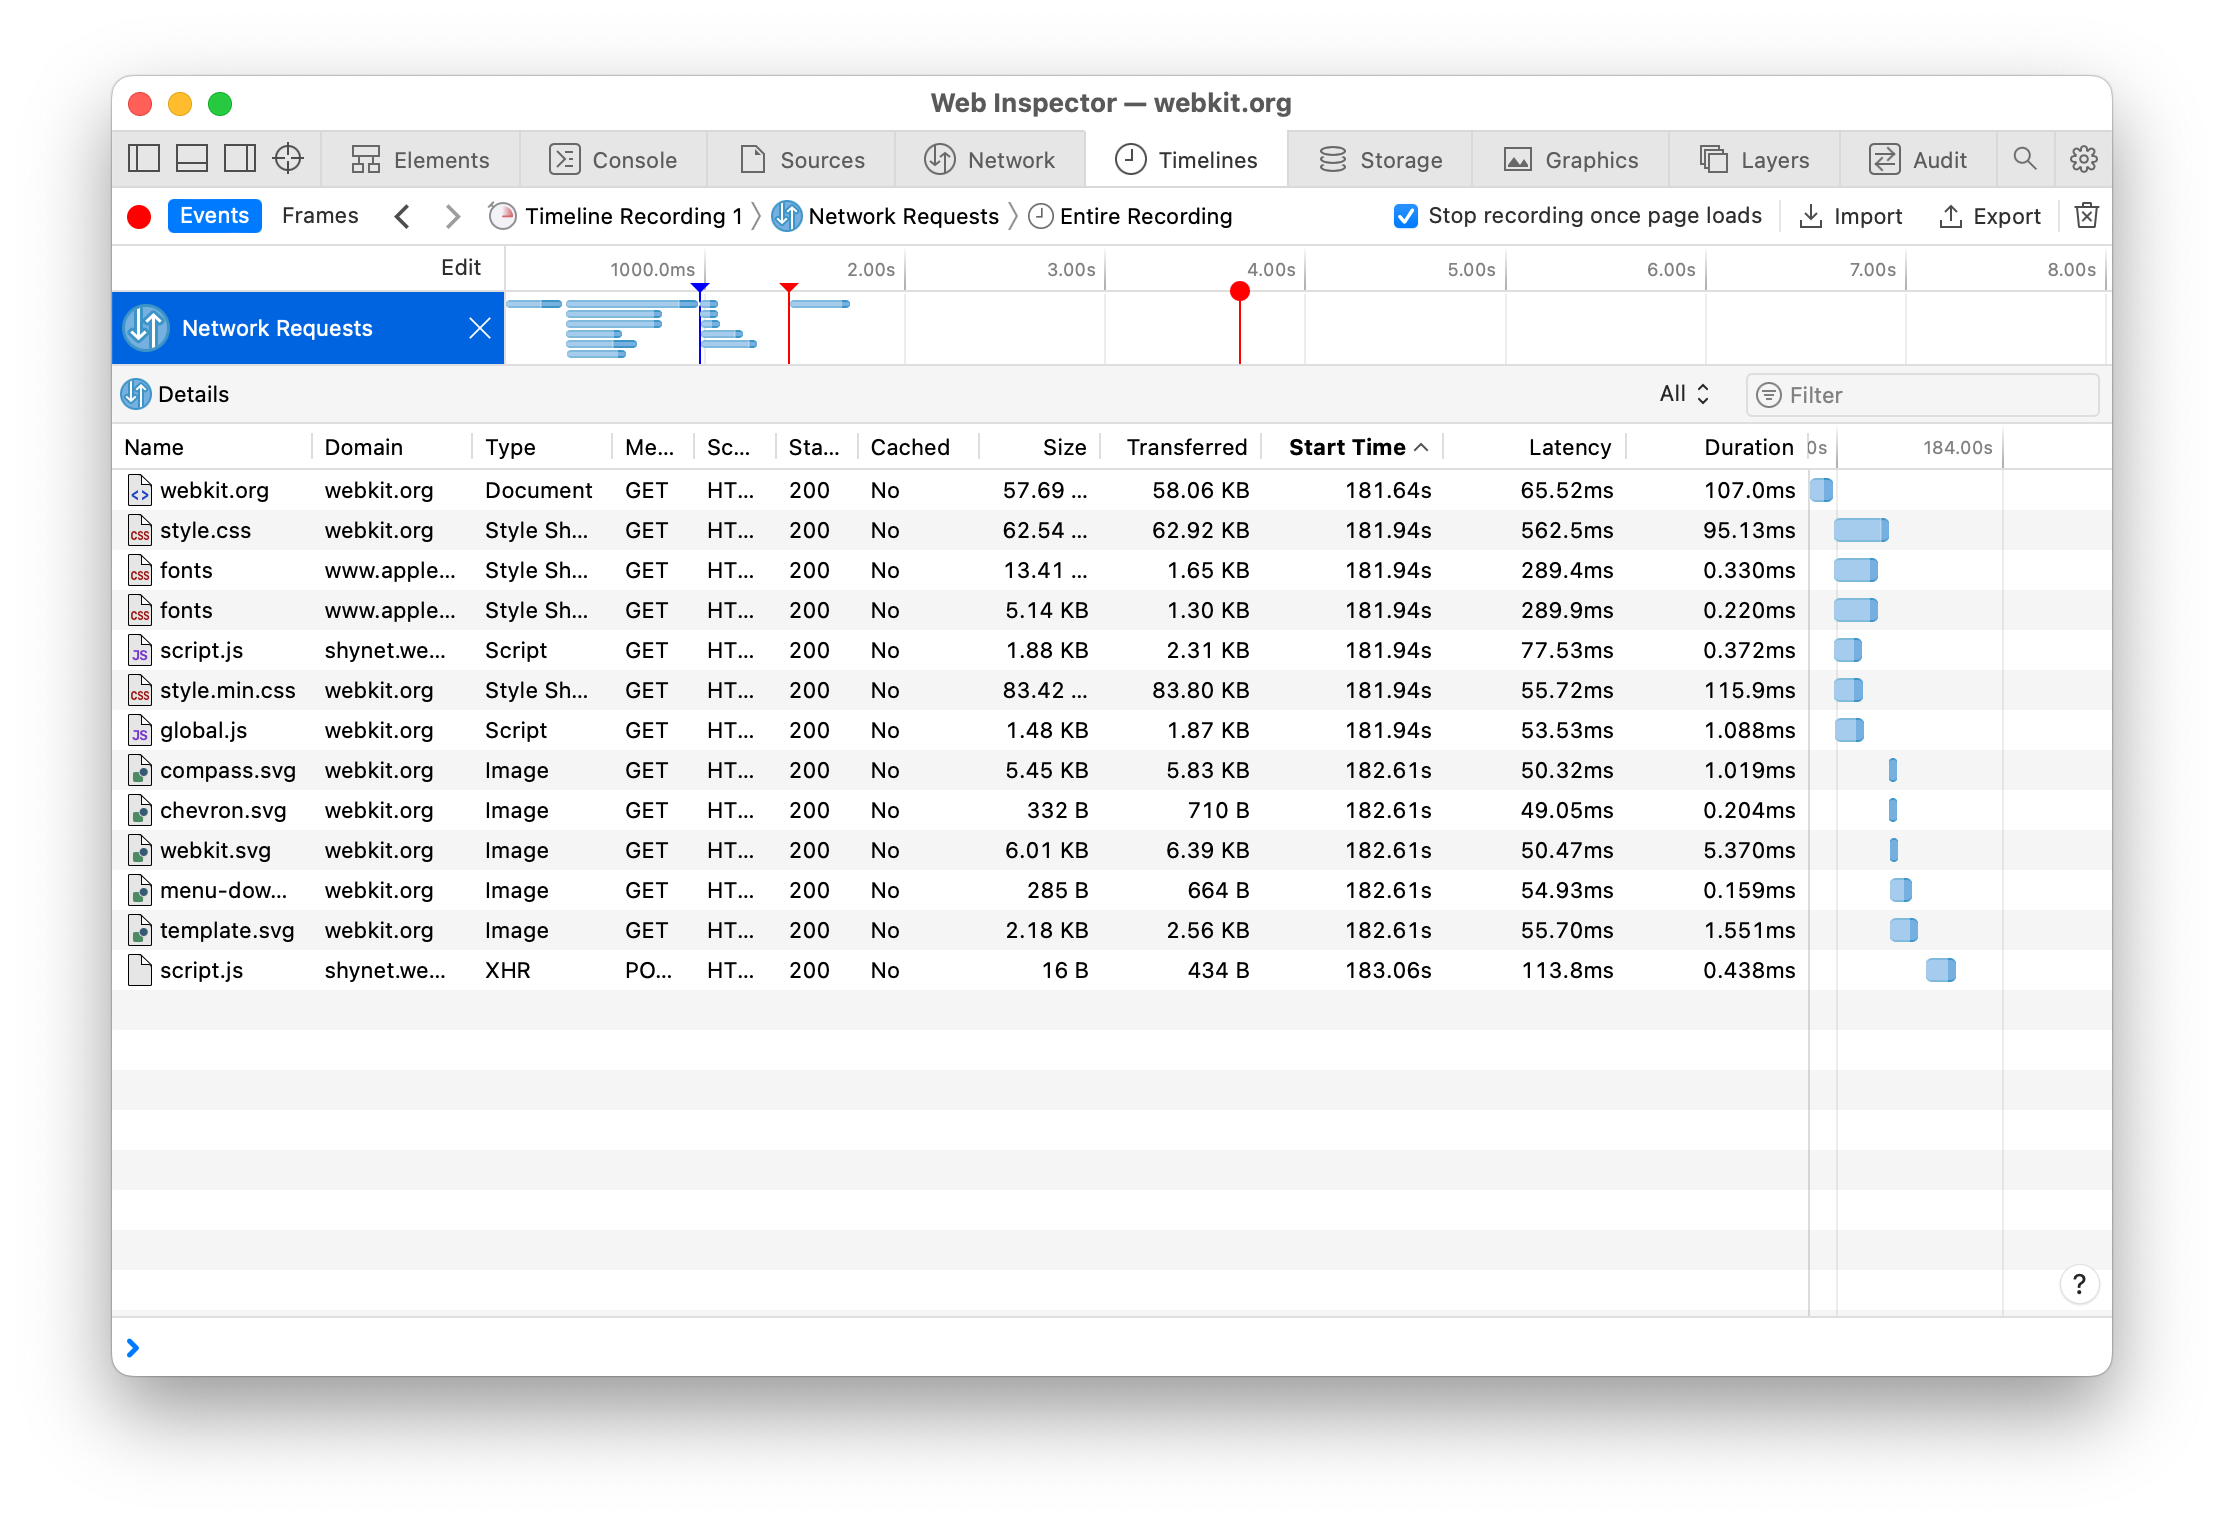
The Network Requests timeline is similar to the Network Tab in that it lists all network activity that occurred during the timeline recording.
-
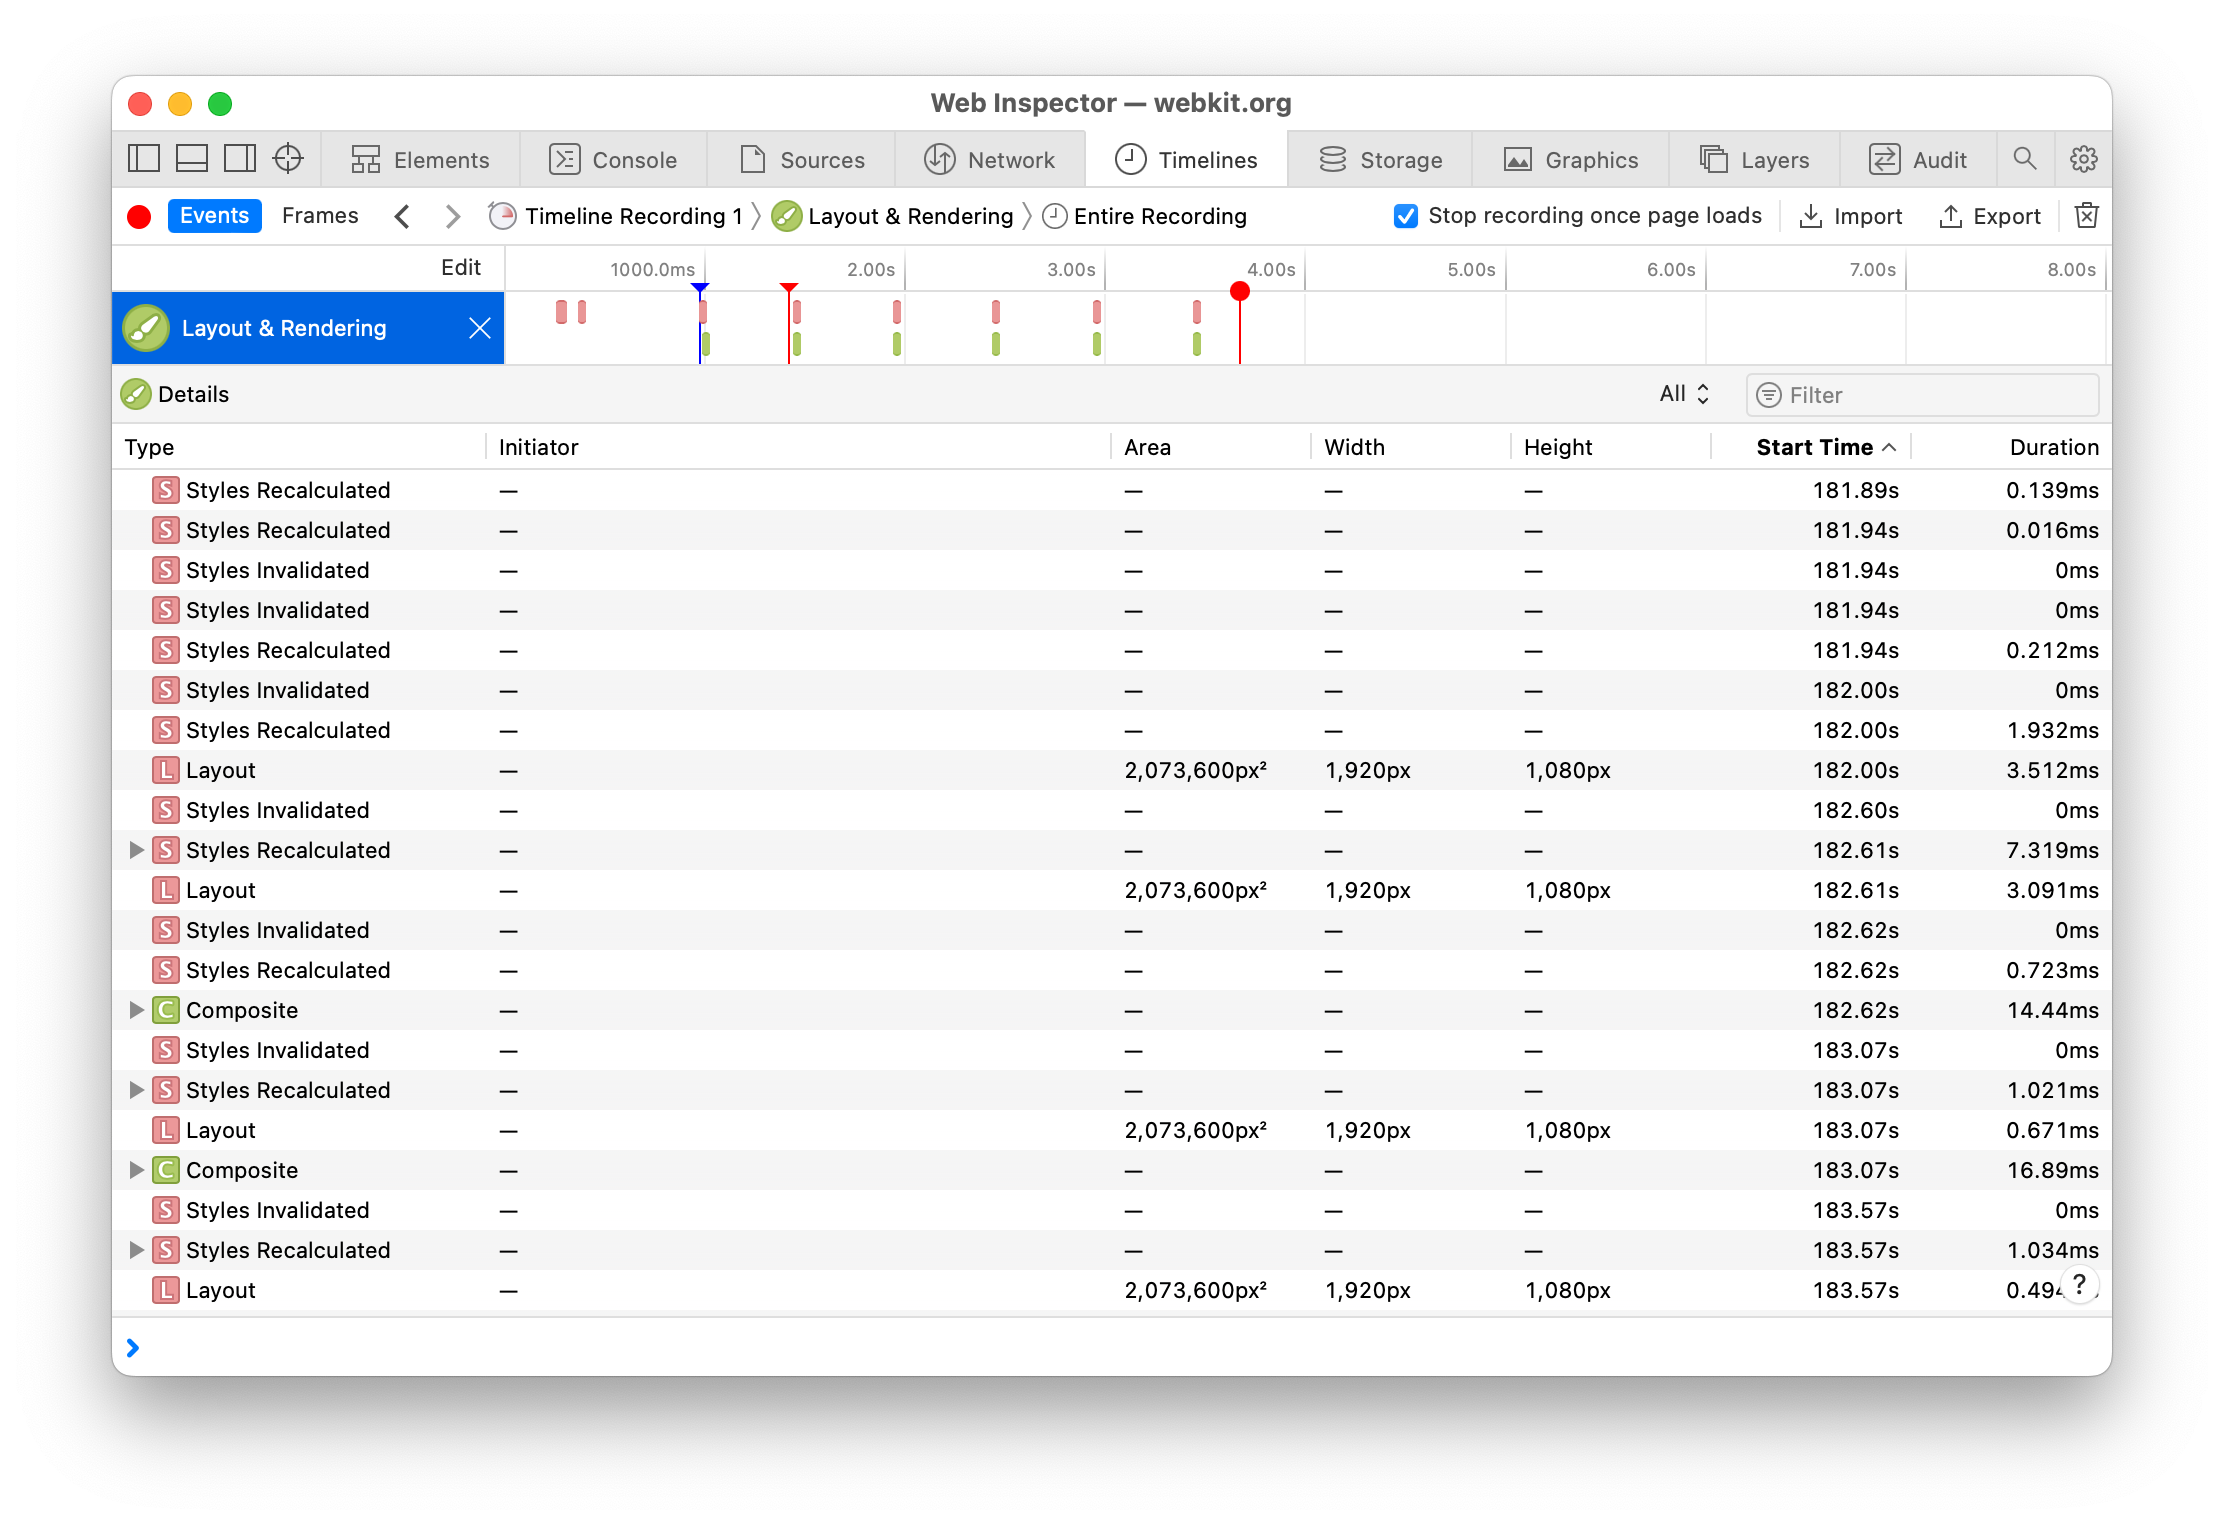
The Layout & Rendering timeline lists every style invalidation or recalculation, layout, composite, and paint that occurred during the timeline recording, including information about the size of each and a link to the JavaScript that triggered it (if applicable).
-
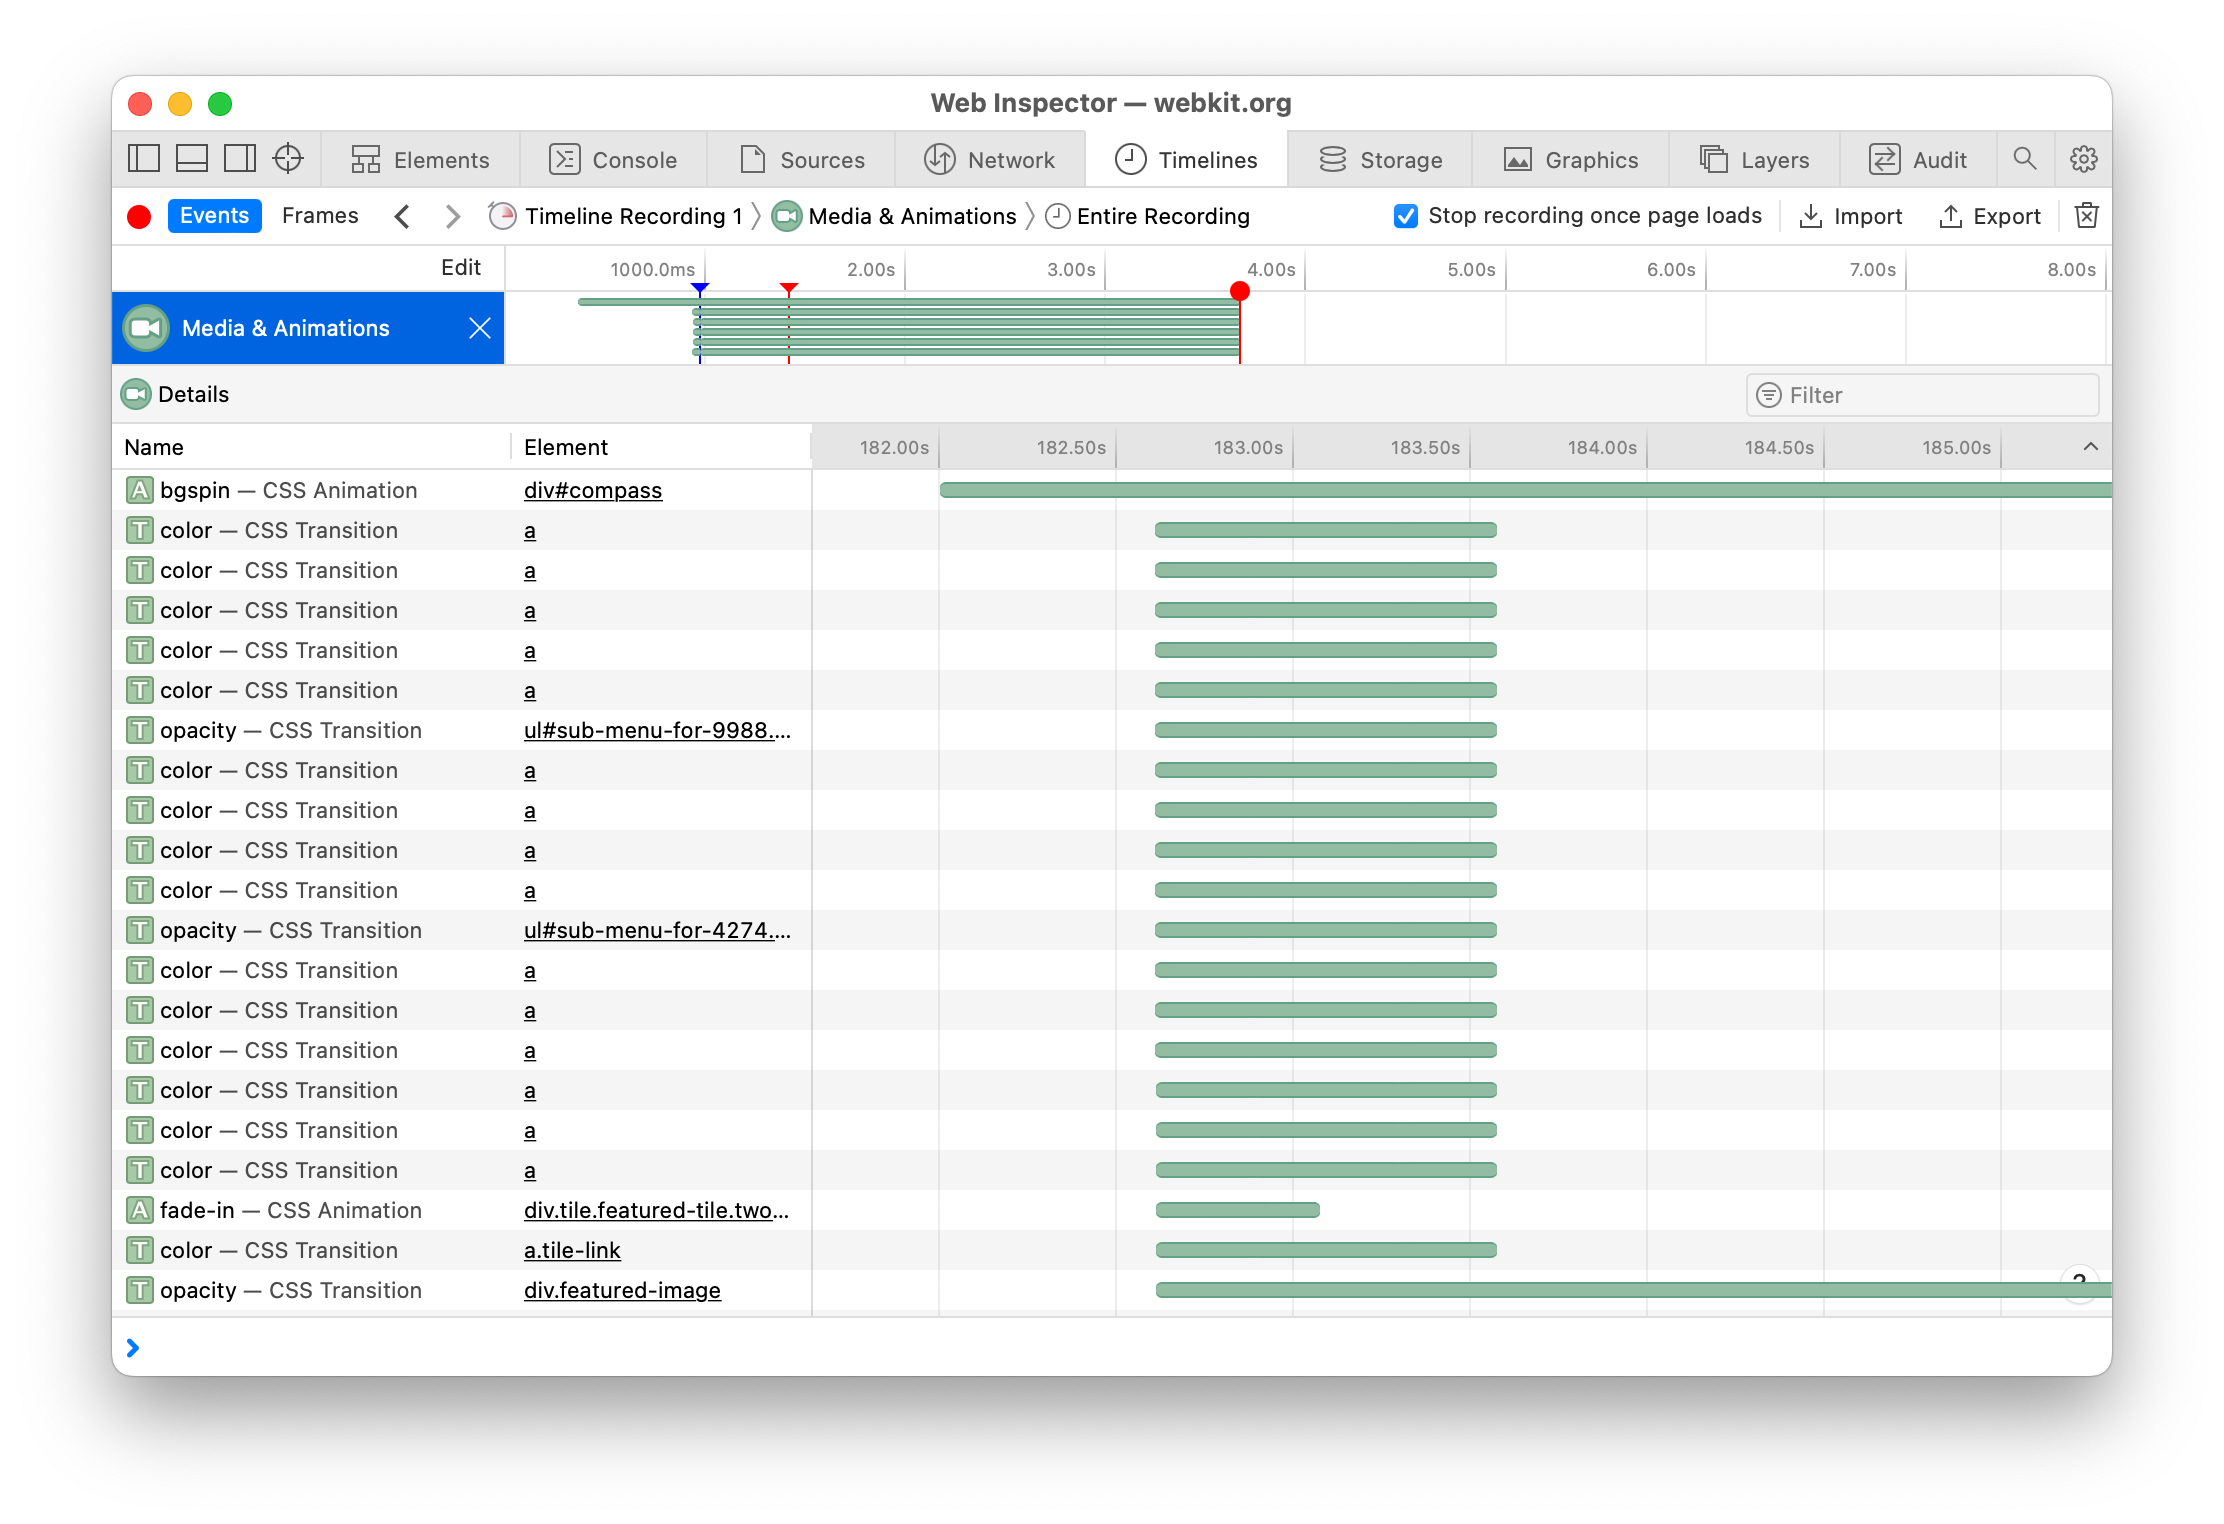
The Media & Animations timeline lists all media elements (e.g.
<video>), CSS animations, and CSS transitions, plotting the various DOM events dispatched by each over time during the timeline recording.This timeline is initially disabled because it can impact the performance of the inspected page during a timeline recording.
-
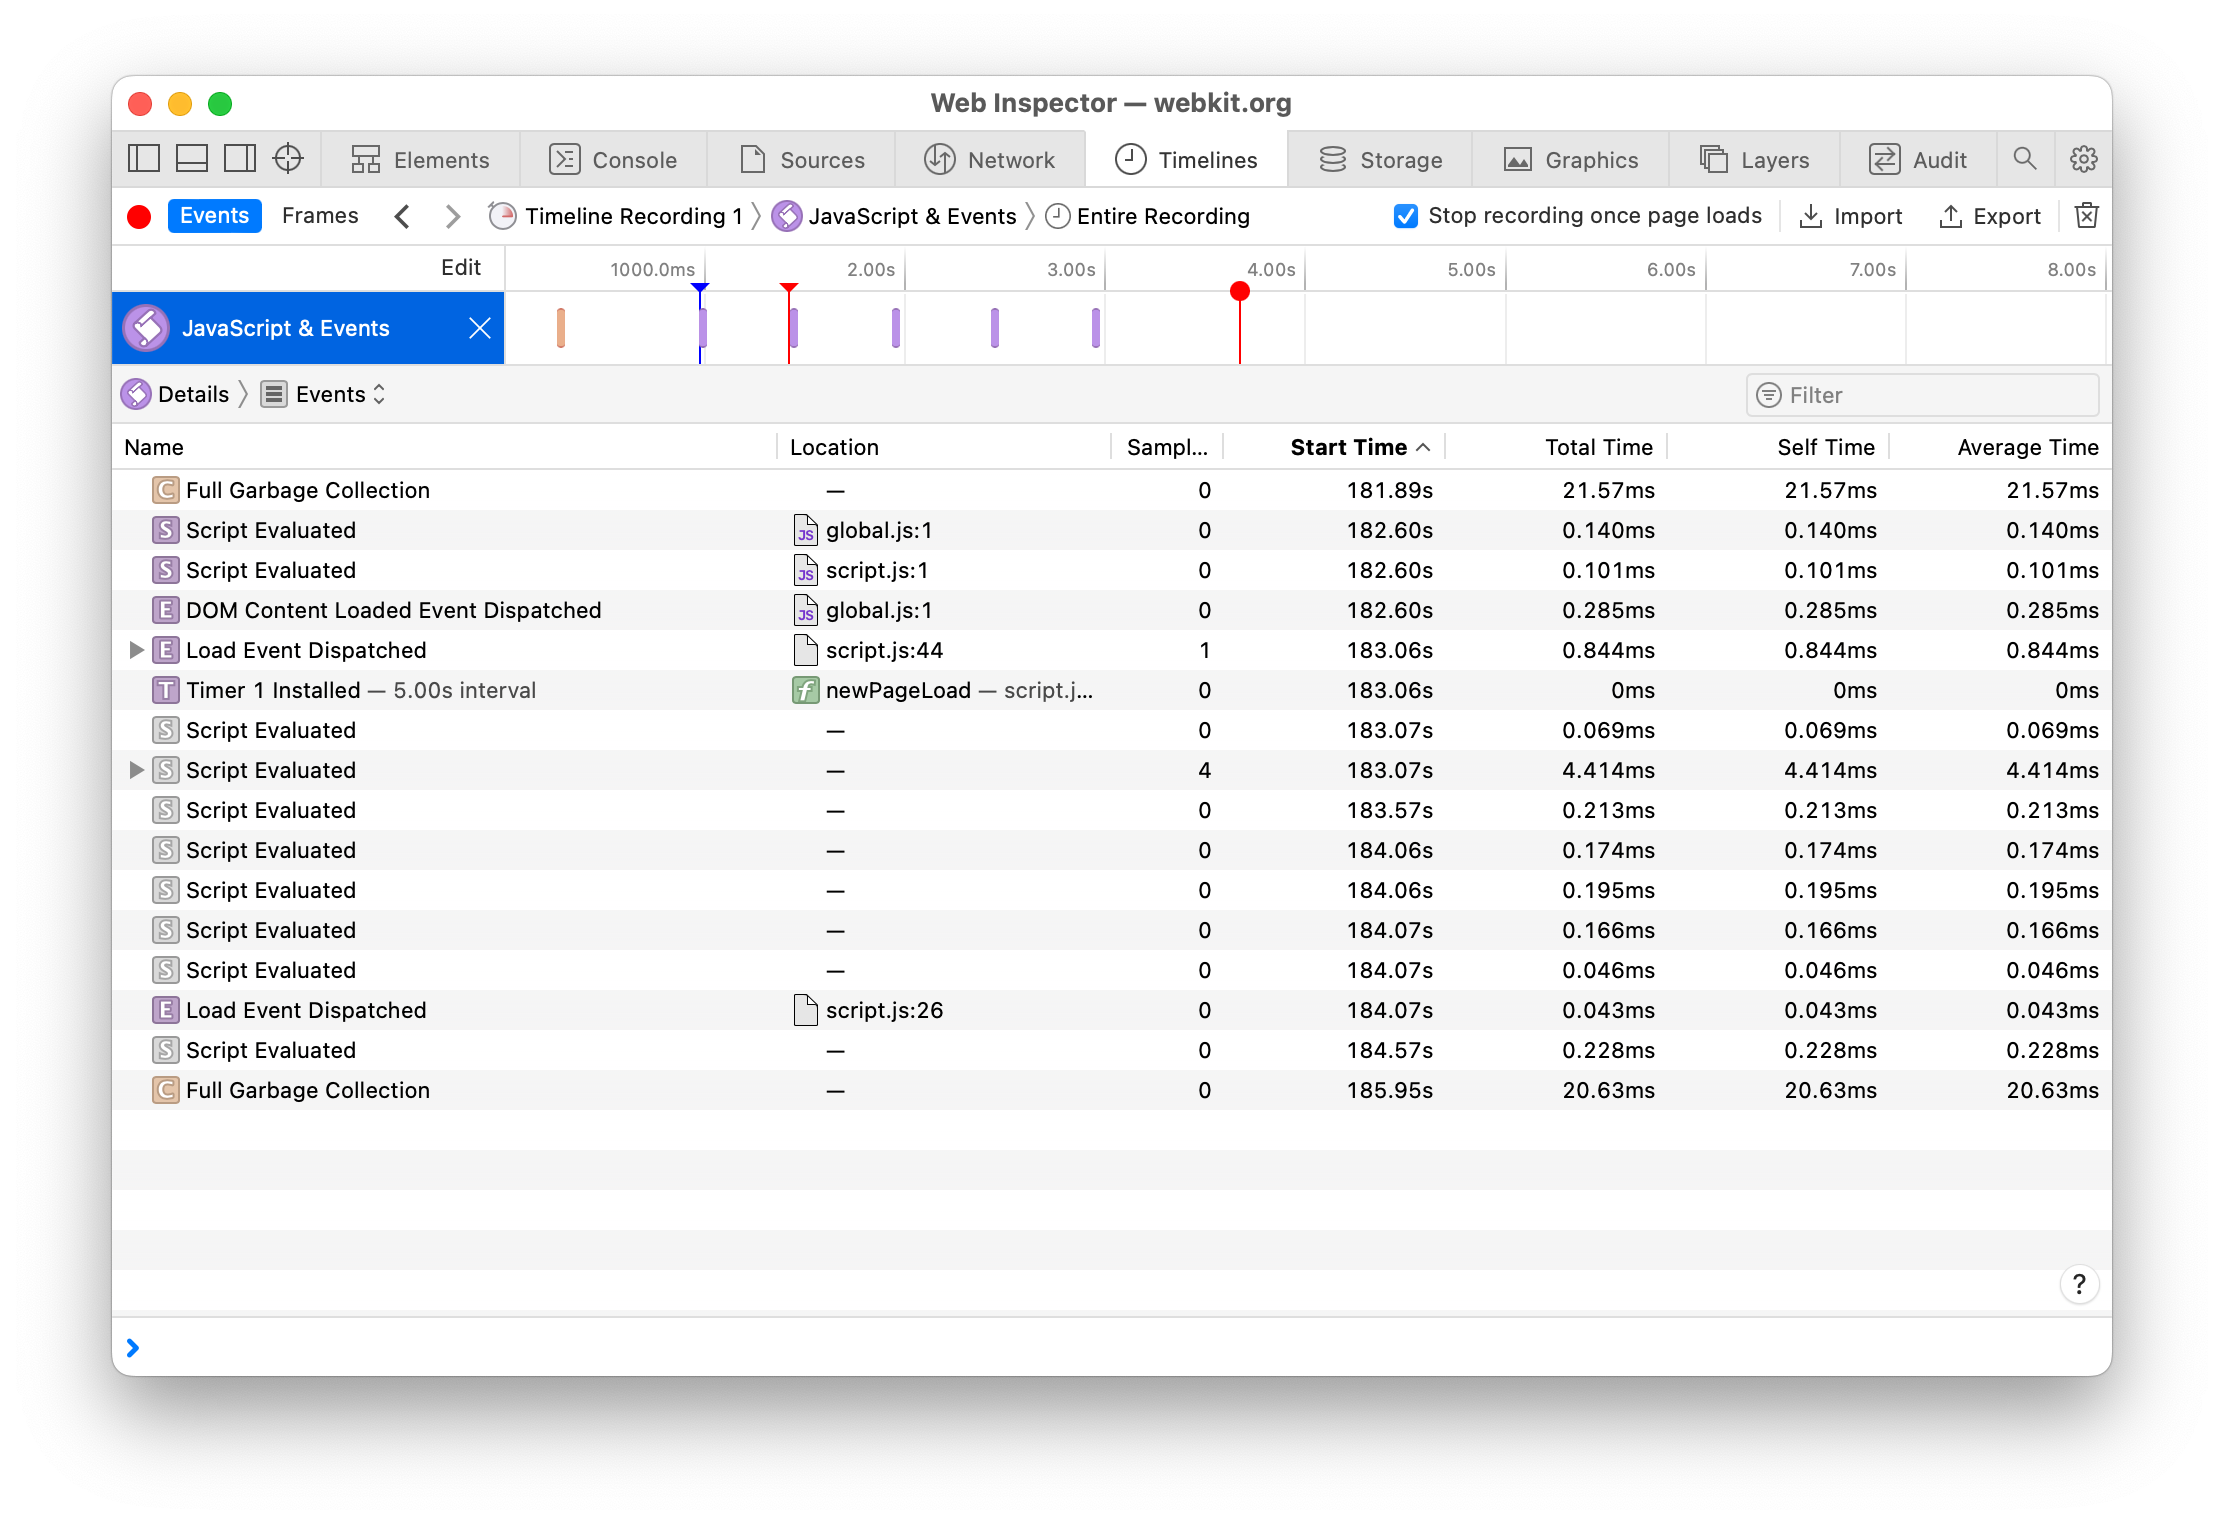
The JavaScript & Events timeline samples JavaScript activity to produce call trees, organized either by the sequential entry to script (e.g. script evaluation, event dispatch,
setTimeout, etc.) that contained the activity or as a time-independent combined call tree. -
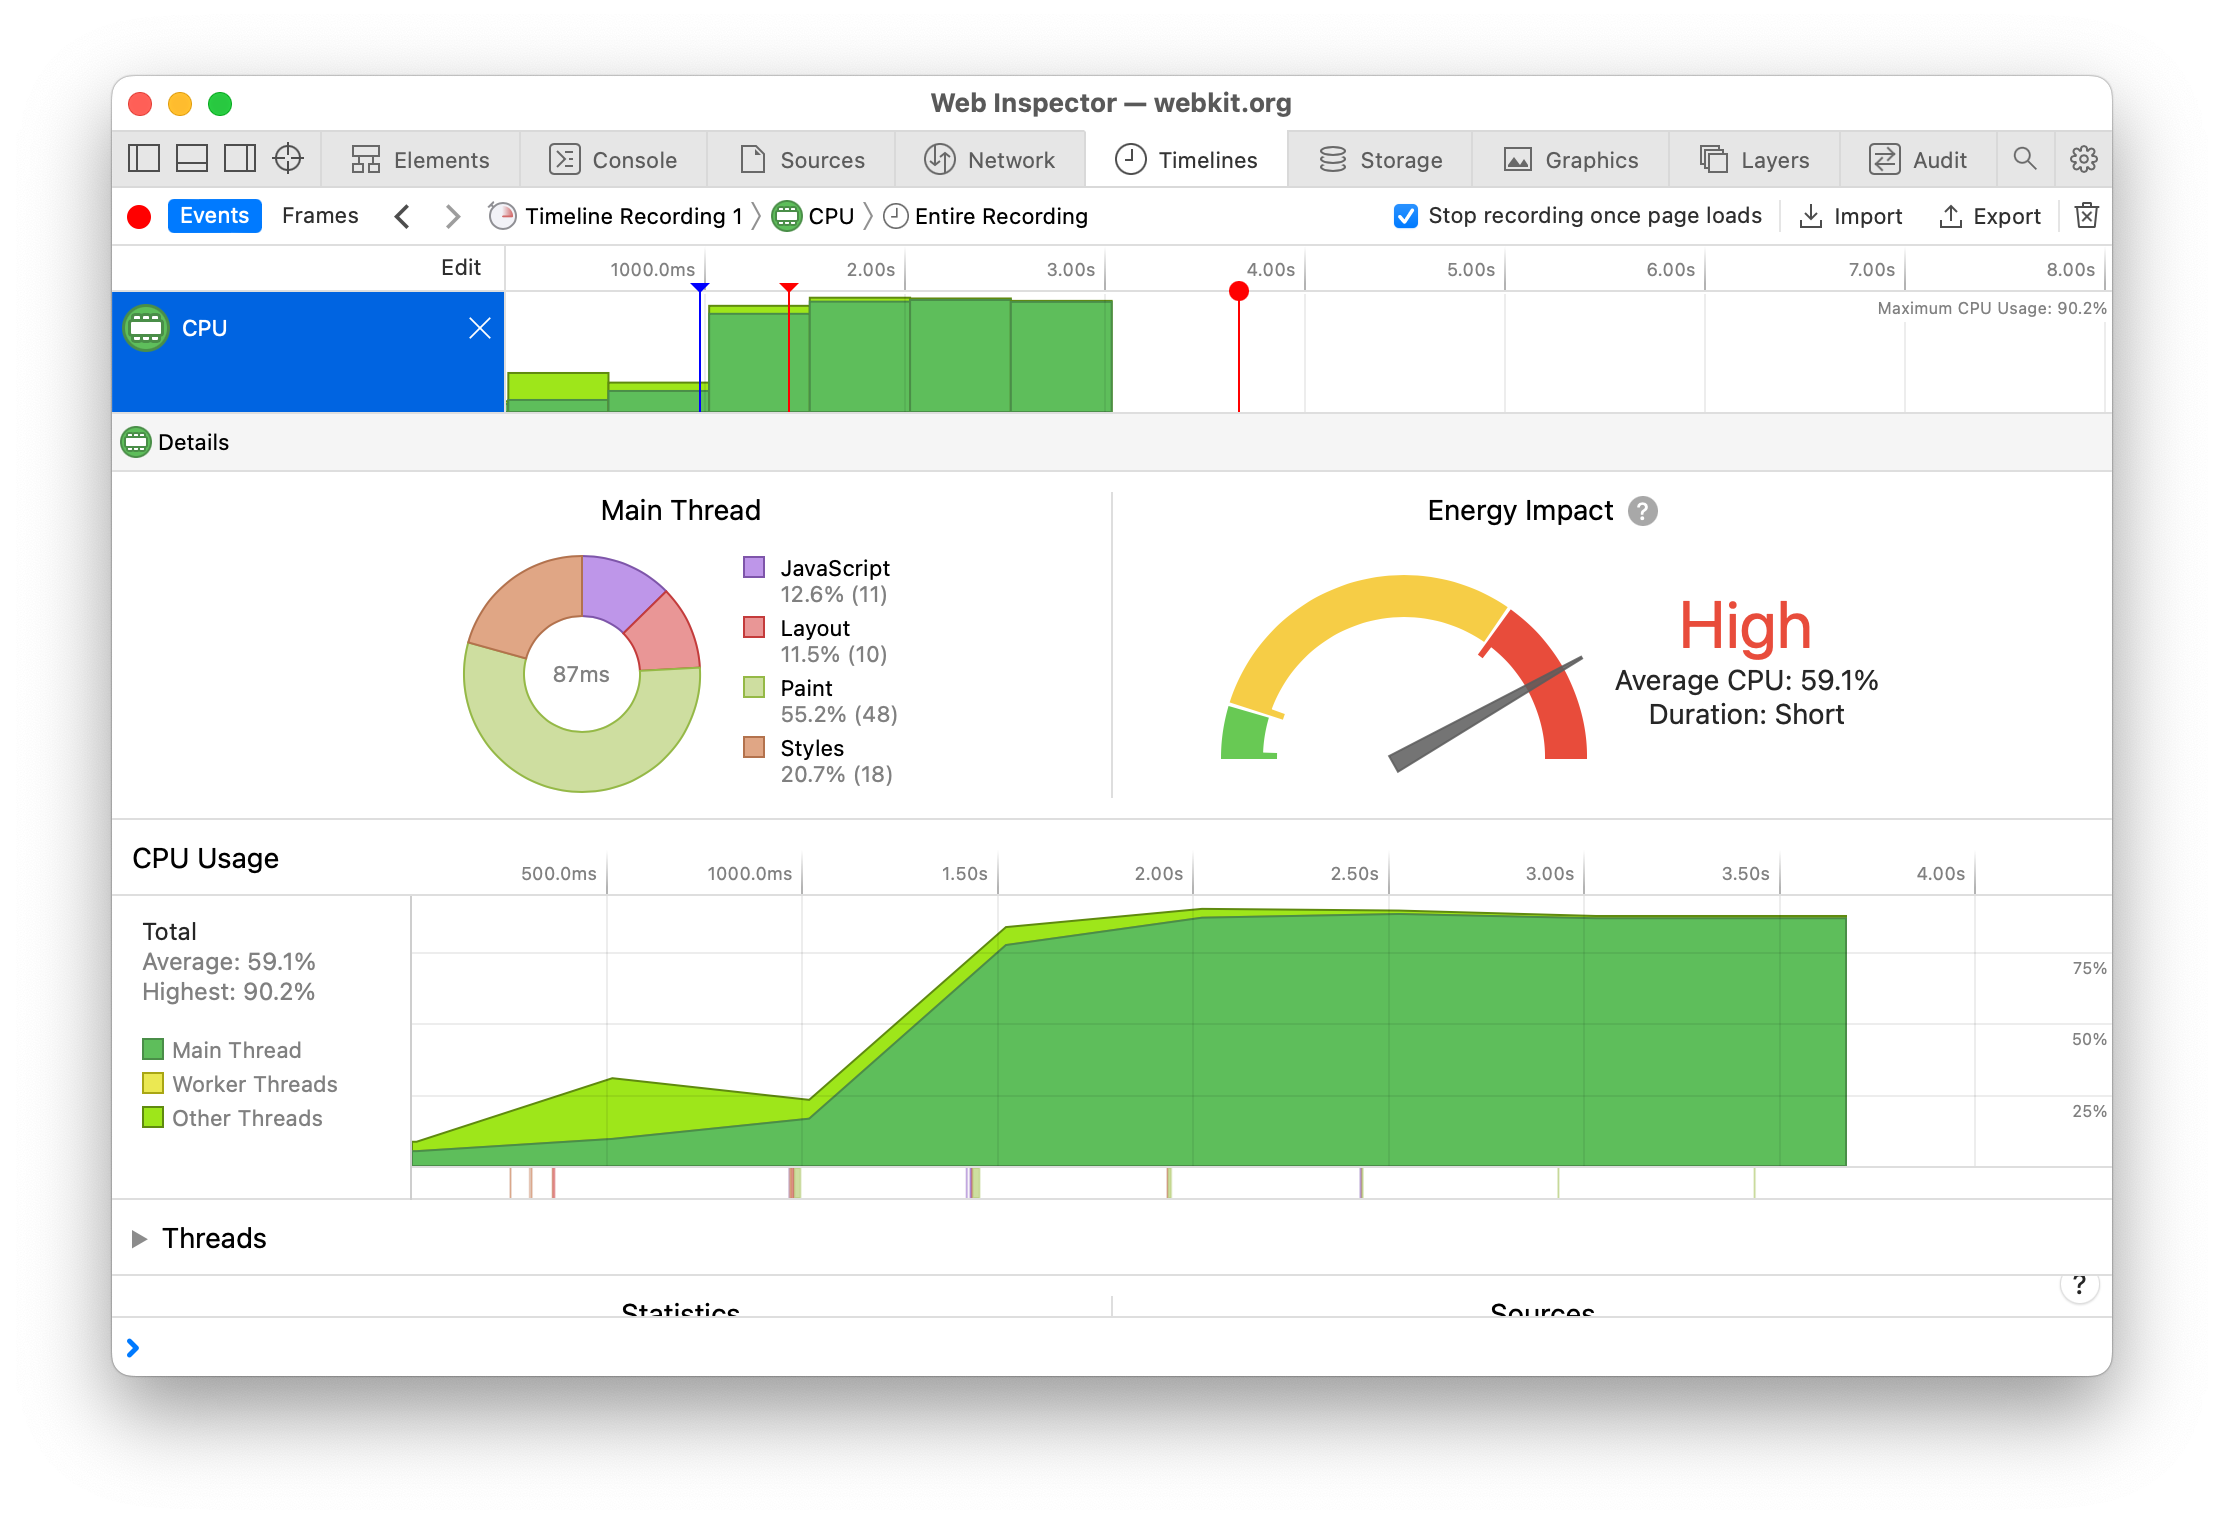
The CPU timeline graphs the CPU usage of all threads related to the inspected page during the timeline recording, as well as lists additional statistics about the number and type of event listeners, timers, network activity, script entries, etc. that were executed during the timeline recording.
-
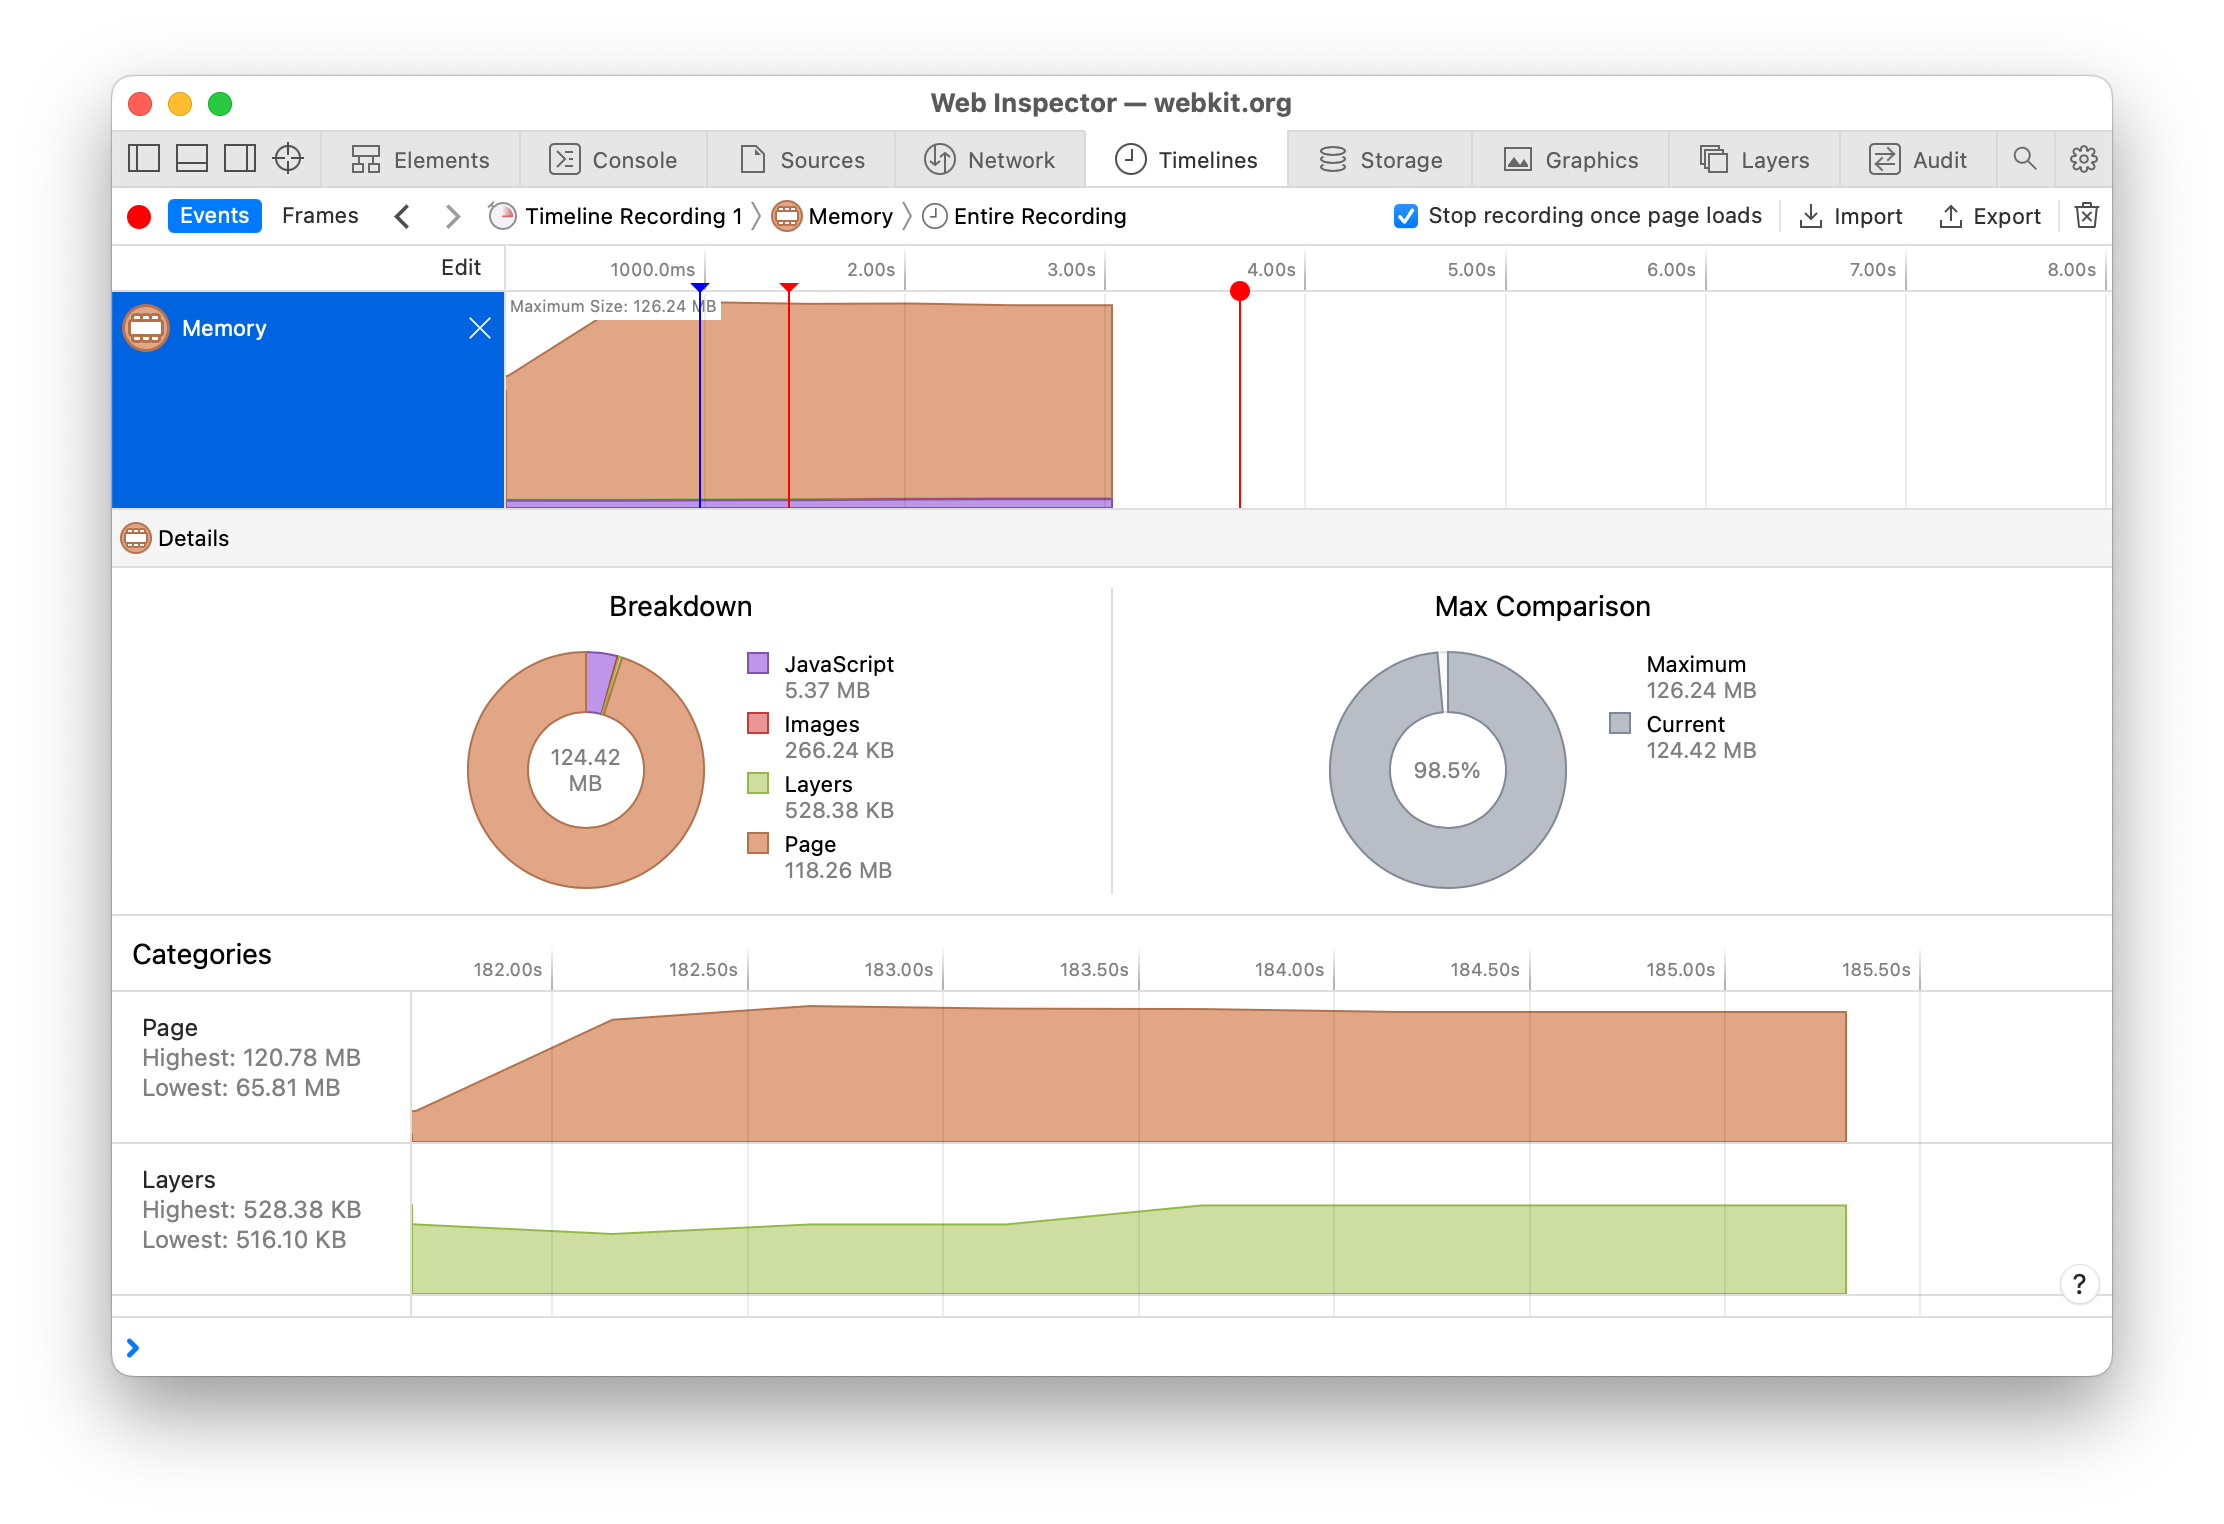
The Memory timeline graphs a breakdown of the memory usage of the inspected page based on how that memory is used during the timeline recording.
This timeline is initially disabled because it can impact the performance of the inspected page during a timeline recording.
-
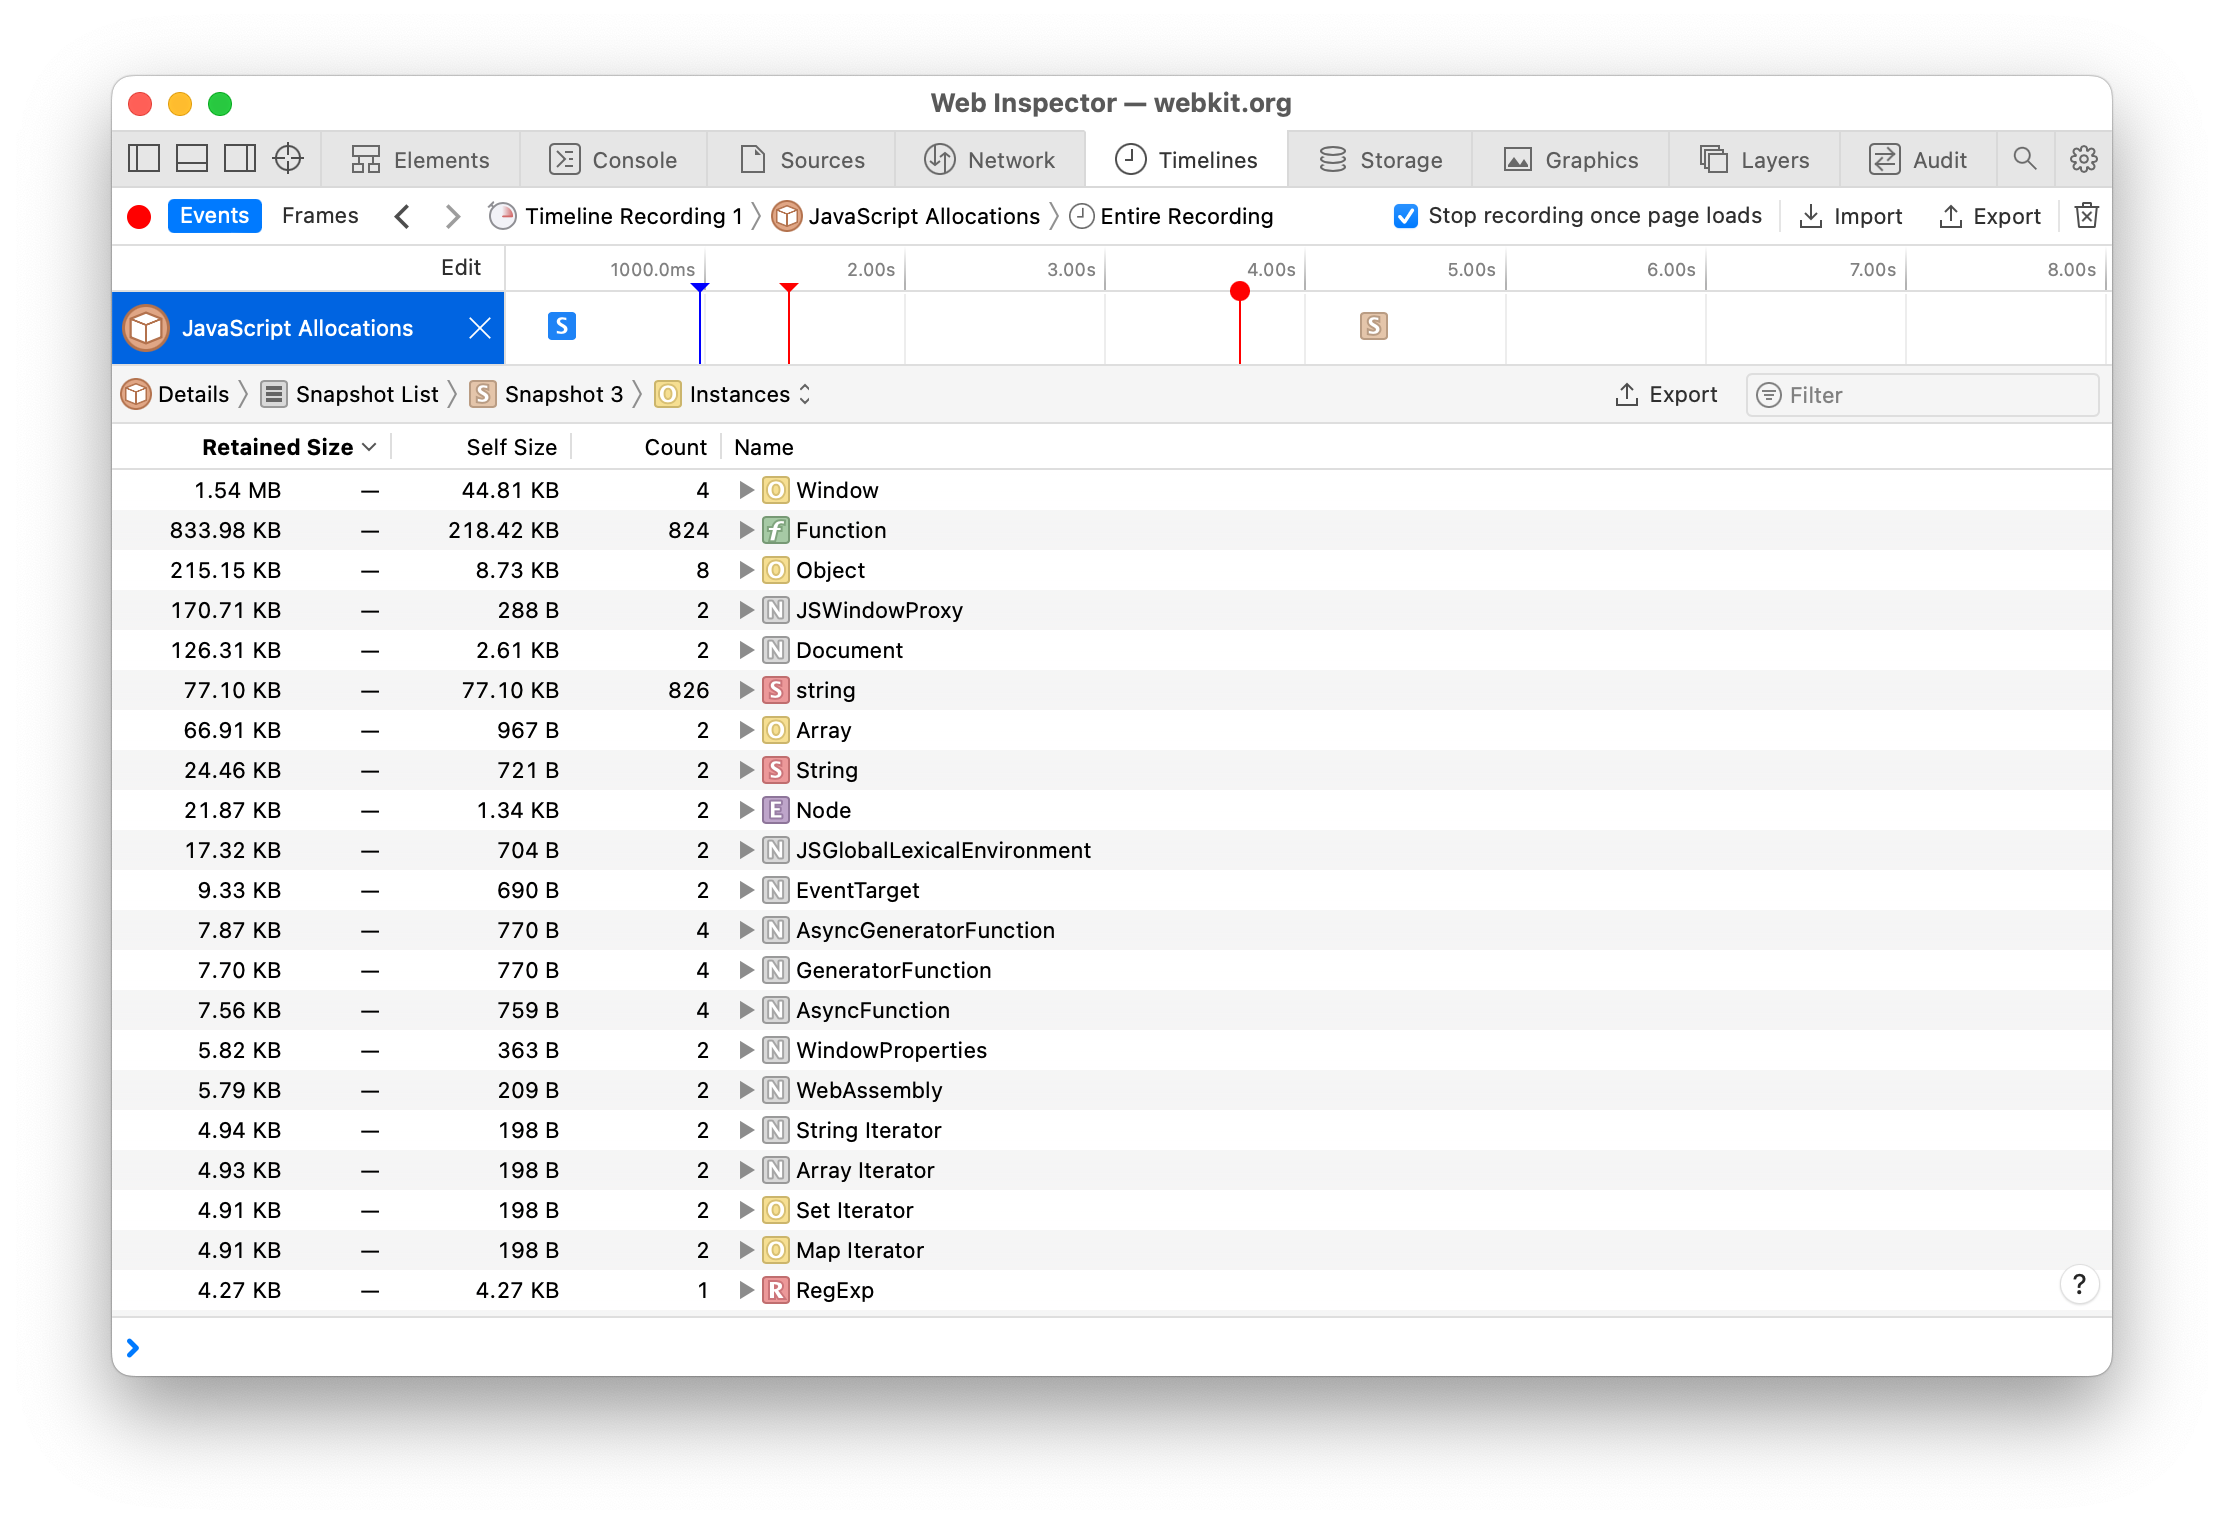
The JavaScript Allocations timeline lists all JavaScript heap snapshots that have been captured since Web Inspector was opened and also contains tools for comparing the existence and of objects in heap snapshots and visualizing the shortest path from any given object to the root global object.
JavaScript heap snapshots are automatically captured when the timeline recording starts, right before the timeline recording ends, and every 10s during a timeline recording, but can also be manually captured at any time by clicking
console.takeHeapSnapshot.This timeline is initially disabled because it can impact the performance of the inspected page during a timeline recording.
Frames View
The Frames view is essentially a different way of organizing the data captured during a recording. Rather than organize the data based on the “type” of activity (i.e. the various timelines in the Events view), the Frames view simply groups activity based on which rendering frame that activity occurred in.
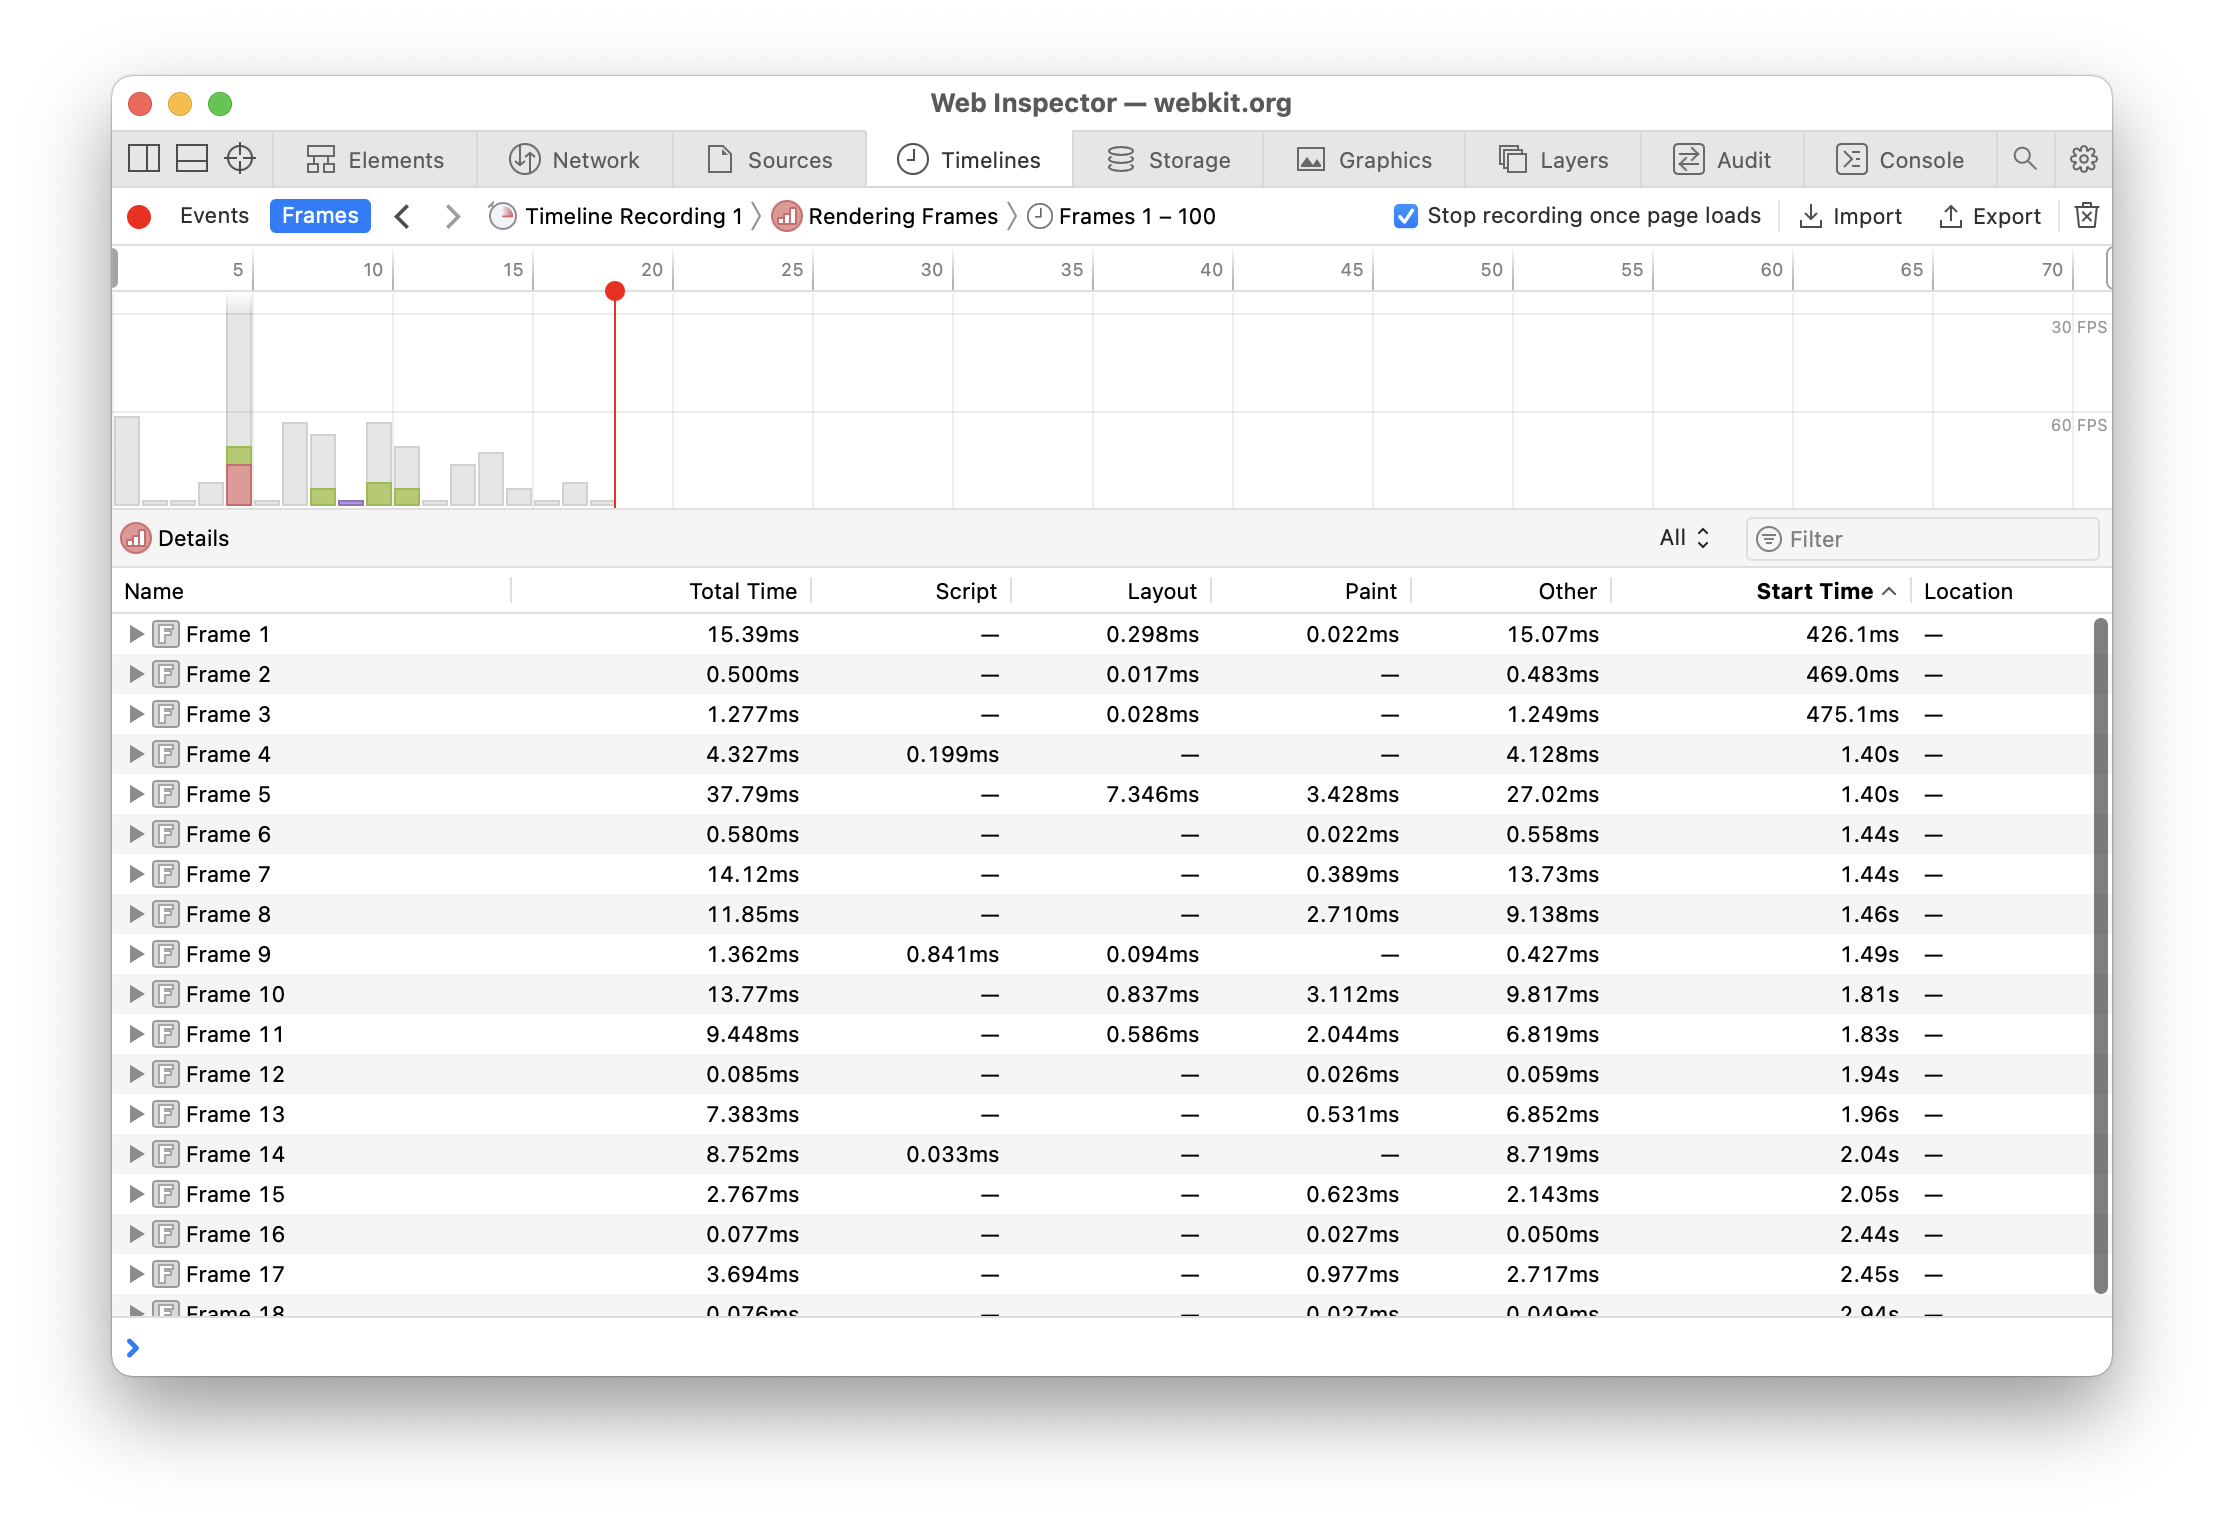
In the graph area, the x-axis represents the sequential list of rendering frames, while the y-axis represents the time it took for that frame to execute (lower or less is better). The horizontal lines for 30 FPS and and 60 FPS are general indicators of time (~33ms and ~16ms respectively) and the likely overall frames-per-second if all rendering frames took that amount of time to execute.
Sharing
Complete recordings can be exported by clicking ⌘ S. Previously exported recordings can later be be imported by clicking




 Updated for