Memory Debugging with Web Inspector
Web Inspector now includes two new timelines for debugging a webpage’s memory usage. The first is a high-level Memory timeline intended to help developers to better understand the memory characteristics of their webpages, to identify spikes, and to detect general memory growth. The second is a detailed JavaScript Allocations timeline that allows developers to record, compare, and analyze snapshots of the JavaScript heap; useful for finding and addressing JavaScript memory growth and leaks.
Memory Timeline
Webpages come in all shapes and sizes. There may be static pages with lots of images and presentational animations that spike in memory, which can cause a sudden termination on memory-constrained platforms. Or they may be long-living interactive JavaScript applications that start small and accumulate memory over time and slowing down after long use. The high-level Memory timeline helps categorize how memory is being used and identify what may need further investigation.
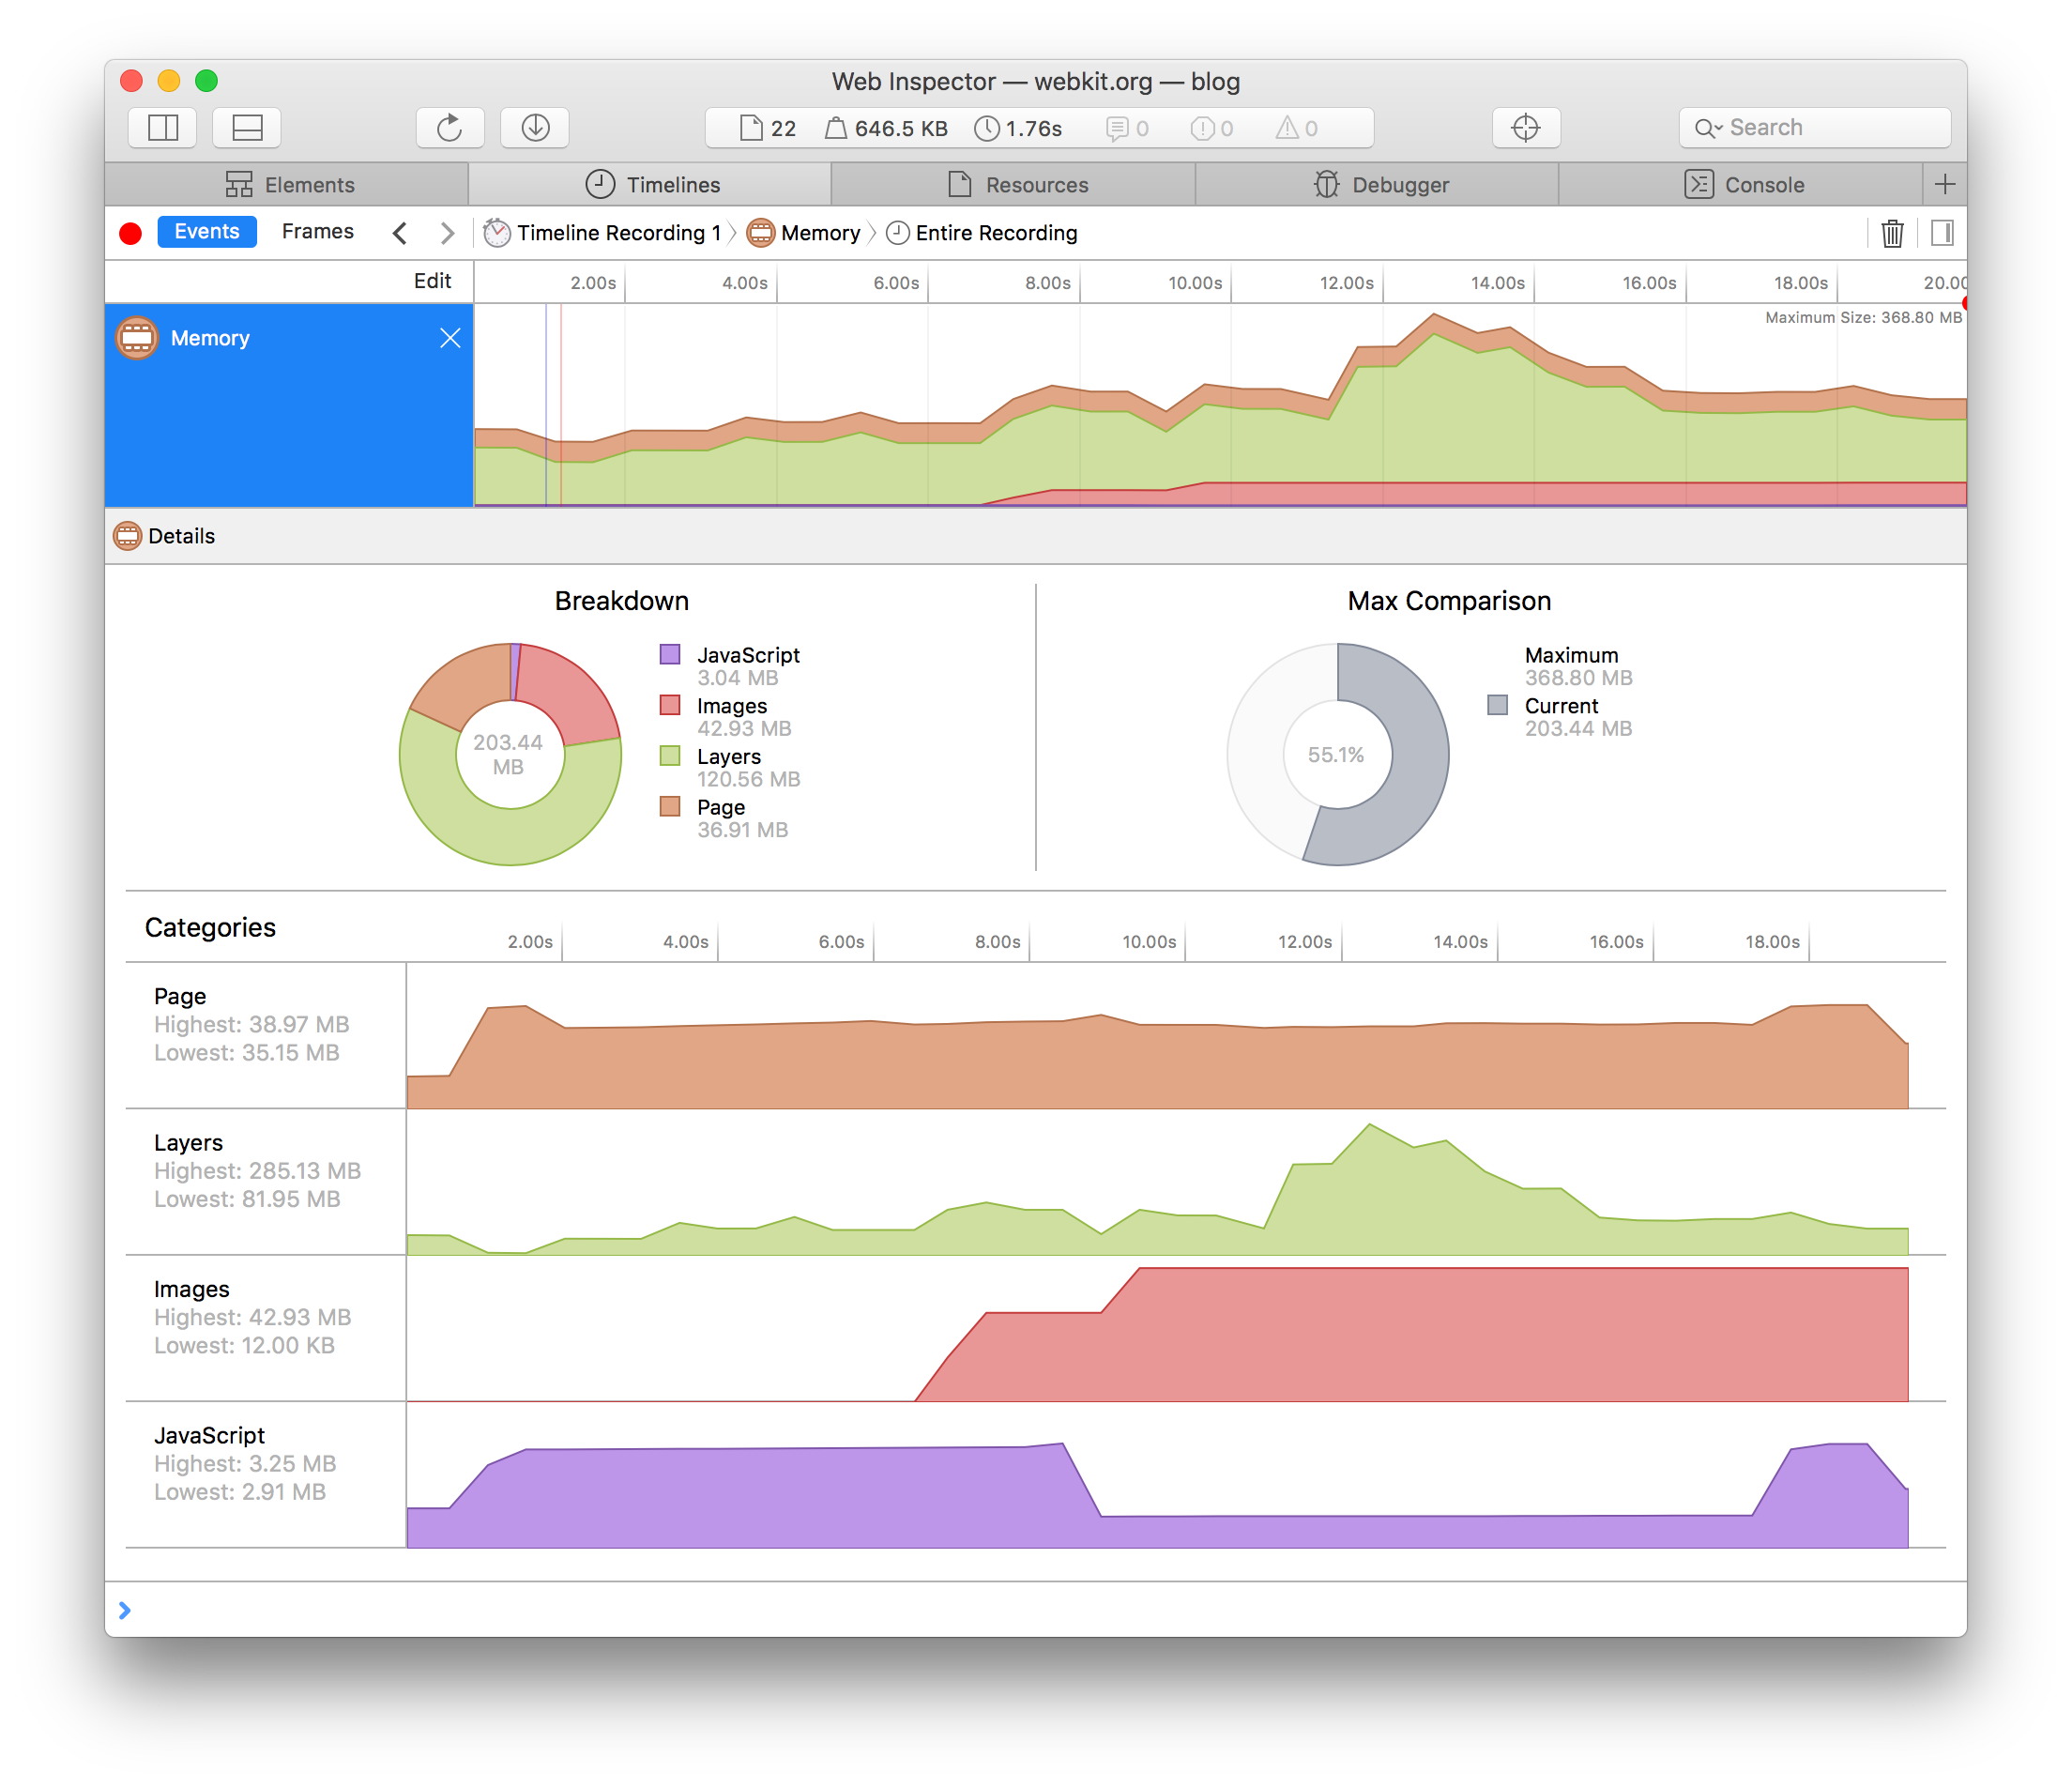
The Memory timeline shows the total memory footprint of the inspected page. It breaks the total memory out into four different categories:
- JavaScript – JavaScript heap size. This includes JavaScript objects, strings, functions, and corresponding engine data associated with these objects. This section will only ever decrease in size due to a garbage collection.
-
Images – Decoded image data. Most often this corresponds with the images visible in the viewport.
-
Layers – Graphics layer data. This includes WebKit’s tile grid, page content using compositing layers, and any other layers the engine may make as an implementation detail.
-
Page – All other memory. This includes engine memory related to the DOM, styles, rendering data, memory caches, system allocations, etc.
We feel that these categories give a good overview of most memory used in a webpage. In some pages Layers and Image data will be the largest categories, but on others the JavaScript heap may be larger. Having this breakdown gives you a place to start for investigating spikes and growth.

When investigating memory spikes, the Max Comparison memory chart can be useful. After selecting a specific time range at the top, you can see how the total memory usage at the end of the selection compares to the peak memory seen during the recording. The timeline will also include markers when apps receive memory pressure events.
Once you have the breakdown, you have an idea of where to look to make reductions. For large Image data, inspect your Image resources. To debug Layer data, use Web Inspector to enable Layer Borders to highlight the visible content on the page that uses compositing layers. For inspecting the JavaScript heap, we have the new JavaScript Allocations timeline. Before we look at this new timeline, let’s refresh our understanding of JavaScript object lifetimes.
JavaScript Leaks
JavaScript is a garbage collected language. As objects are created and modified, the engine automatically allocates any necessary memory for the objects. Once an object is no longer referenced, the engine can reclaim (“collect”) the memory allocated for that object.
To determine if an object should be kept alive or collected, the engine has to check if the object is reachable from a set of root objects. The window object in a webpage is a root object. The engine may have its own internal list of other root objects. JavaScriptCore includes a conservative garbage collector, so it treats any address on the stack that points to a heap allocated object as a root.
By following references from these root objects to other objects, and recursively on to objects they reference, the engine can mark all of the objects that are reachable (“live”), and should be kept alive. At the end, all of the objects in the heap that are not marked are unreachable (“dead”) and can be collected.
JavaScript applications will grow in memory as new objects are created and referenced. A memory leak occurs when objects that are no longer needed are still referenced, causing their memory to not be released. In JavaScript this can happen unintentionally if application logic fails to clear a reference to an object that is no longer needed.
Many leaks may be obvious once pointed out. For example, in this snippet a global variable holds onto a NodeList and will be kept alive:
function addClickHandlers() {
    paragraphs = document.querySelectorAll("p");
    for (let p of paragraphs)
        p.addEventListener("click", () => console.log("clicked"));
}

addClickHandlers();
The NodeList in paragraphs is not needed after the function returns, but is leaked because it accidentally created a global variable window.paragraphs. Simple errors, like accidentally creating a global variable here, can be caught by using strict mode JavaScript. However, the same pattern can be less obvious:
class ElementDebugger {
    constructor() { this.enabled = false; }

    enable() { this.enabled = true; }
    disable() { this.enabled = false; }

    addElements(selector) {
        this.elements = document.querySelectorAll(selector);
        for (let elem of this.elements) {
            elem.addEventListener("click", (event) => {
                console.log("clicked", elem);
                if (this.enabled)
                    debugger;
            });
        }
    }
}

let paragraphDebugger = new ElementDebugger();
paragraphDebugger.addElements("p");
paragraphDebugger.enable();
In this example, we want the paragraphDebugger global object to be kept alive so that we can enable or disable it whenever we want. However, the elements NodeList may unintentionally be kept around. To avoid the leak here, we could have made a local variable for the list with let elements, or explicitly cleared the reference when it is determined to not be needed anymore, with this.elements = null or this.elements = undefined.
delete operator, but that can introduce its own performance penalties. For named properties on an object, delete should be avoided in favor of just setting the property to null or undefined.The above examples included explicit direct references to objects (variables and object properties). However, data referenced by a closure is not explicit, and it is easy to encounter situations where objects are unnecessarily captured in closures and contribute to memory growth:
class MessageList {
    constructor() { this.messages = []; }
    addMessage(xhr) {
        this.messages.push({
            text() { return xhr.responseText; }
        });
    }
}

window.messageList = new MessageList();

// Add messages from completed XHRs.
messageList.addMessage(xhr1);
messageList.addMessage(xhr2);
In this example, the leak is not as obvious. In addMessage we add an object to our list of messages. Each message has a text method which will get the text for that message. However, we created this method as a closure function() { return xhr.responseText; }. This function captures xhr, so the complete XMLHttpRequest object is being retained by this closure even though we only need a small portion of its data. This is unnecessarily wasteful.
Even worse, this XMLHttpRequest can have event listeners that it retains, and those event listeners may also be closures that retain even more objects! All this, when all we need to retain is just the text. To avoid retaining the XMLHttpRequest in this example, we can just avoid capturing it in our closure, and we can instead just keep the data we need:
addMessage(xhr) {
    let messageText = xhr.responseText;
    this.messages.push({
        text() { return messageText; }
    });
}
For many webpages small memory growth is not problematic. The page will use a bit of extra memory, but when the user navigates it will get cleaned up. Memory growth becomes a much bigger problem with long running JavaScript applications. As small to medium memory leaks build up over time, the application’s performance can start to degrade. Ultimately the memory footprint may reach the limits of memory-constrained devices and cause a crash.
JavaScript Allocations Timeline
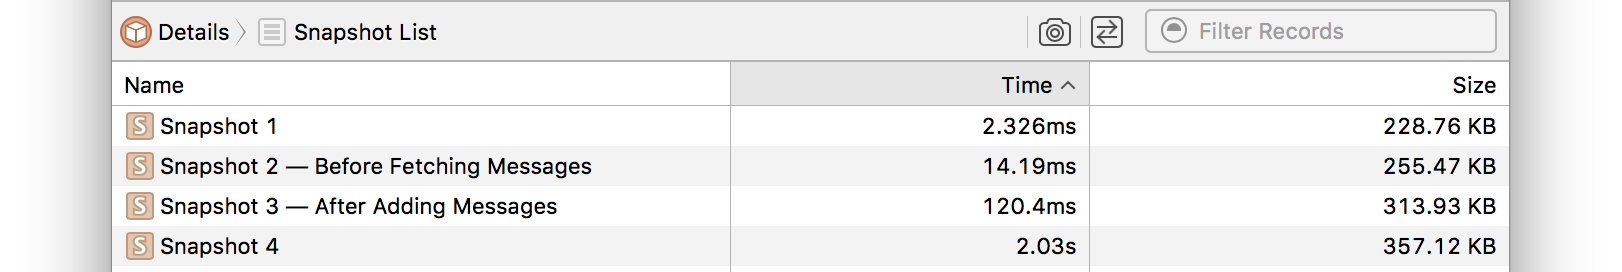
The JavaScript Allocations Timeline gathers snapshots of the JavaScript heap which can then be analyzed. The timeline takes a snapshot at the start of recording, periodically during the recording, and at the end of recording. You can also use the button in the timeline’s navigation bar or call console.takeHeapSnapshot(<label>) in your code.
A heap snapshot performs a full garbage collection and builds a graph of nodes (the live JavaScript objects) and directed edges (the references between the nodes). Node data includes some basic information about the object: a unique identifier, type, and size. Edge data lets us later know exactly how this object was kept alive, so we record a name for the edge that will be useful when displaying this path. For example if the edge was an object property we would record the property name, or if it is a captured closure variable we record the name of the variable.
The snapshot itself does not retain any JavaScript objects. This is important for detecting leaks; you want to allow objects to get collected, so that later you can identify the leaked objects which were not collected.
When you drill into an individual snapshot, we provide a few different views that let you explore and inspect. There is the Object Graph view, which allows you to explore the heap from a set of root objects, namely Window objects. Then there is the Instances view, which groups objects by class. Because we are connected to the live page, if a particular object is still alive we can provide a preview of the object and you can even log the value to Web Inspector’s console and interact with the object directly. Collected objects are removed from the top level of the Instances view.
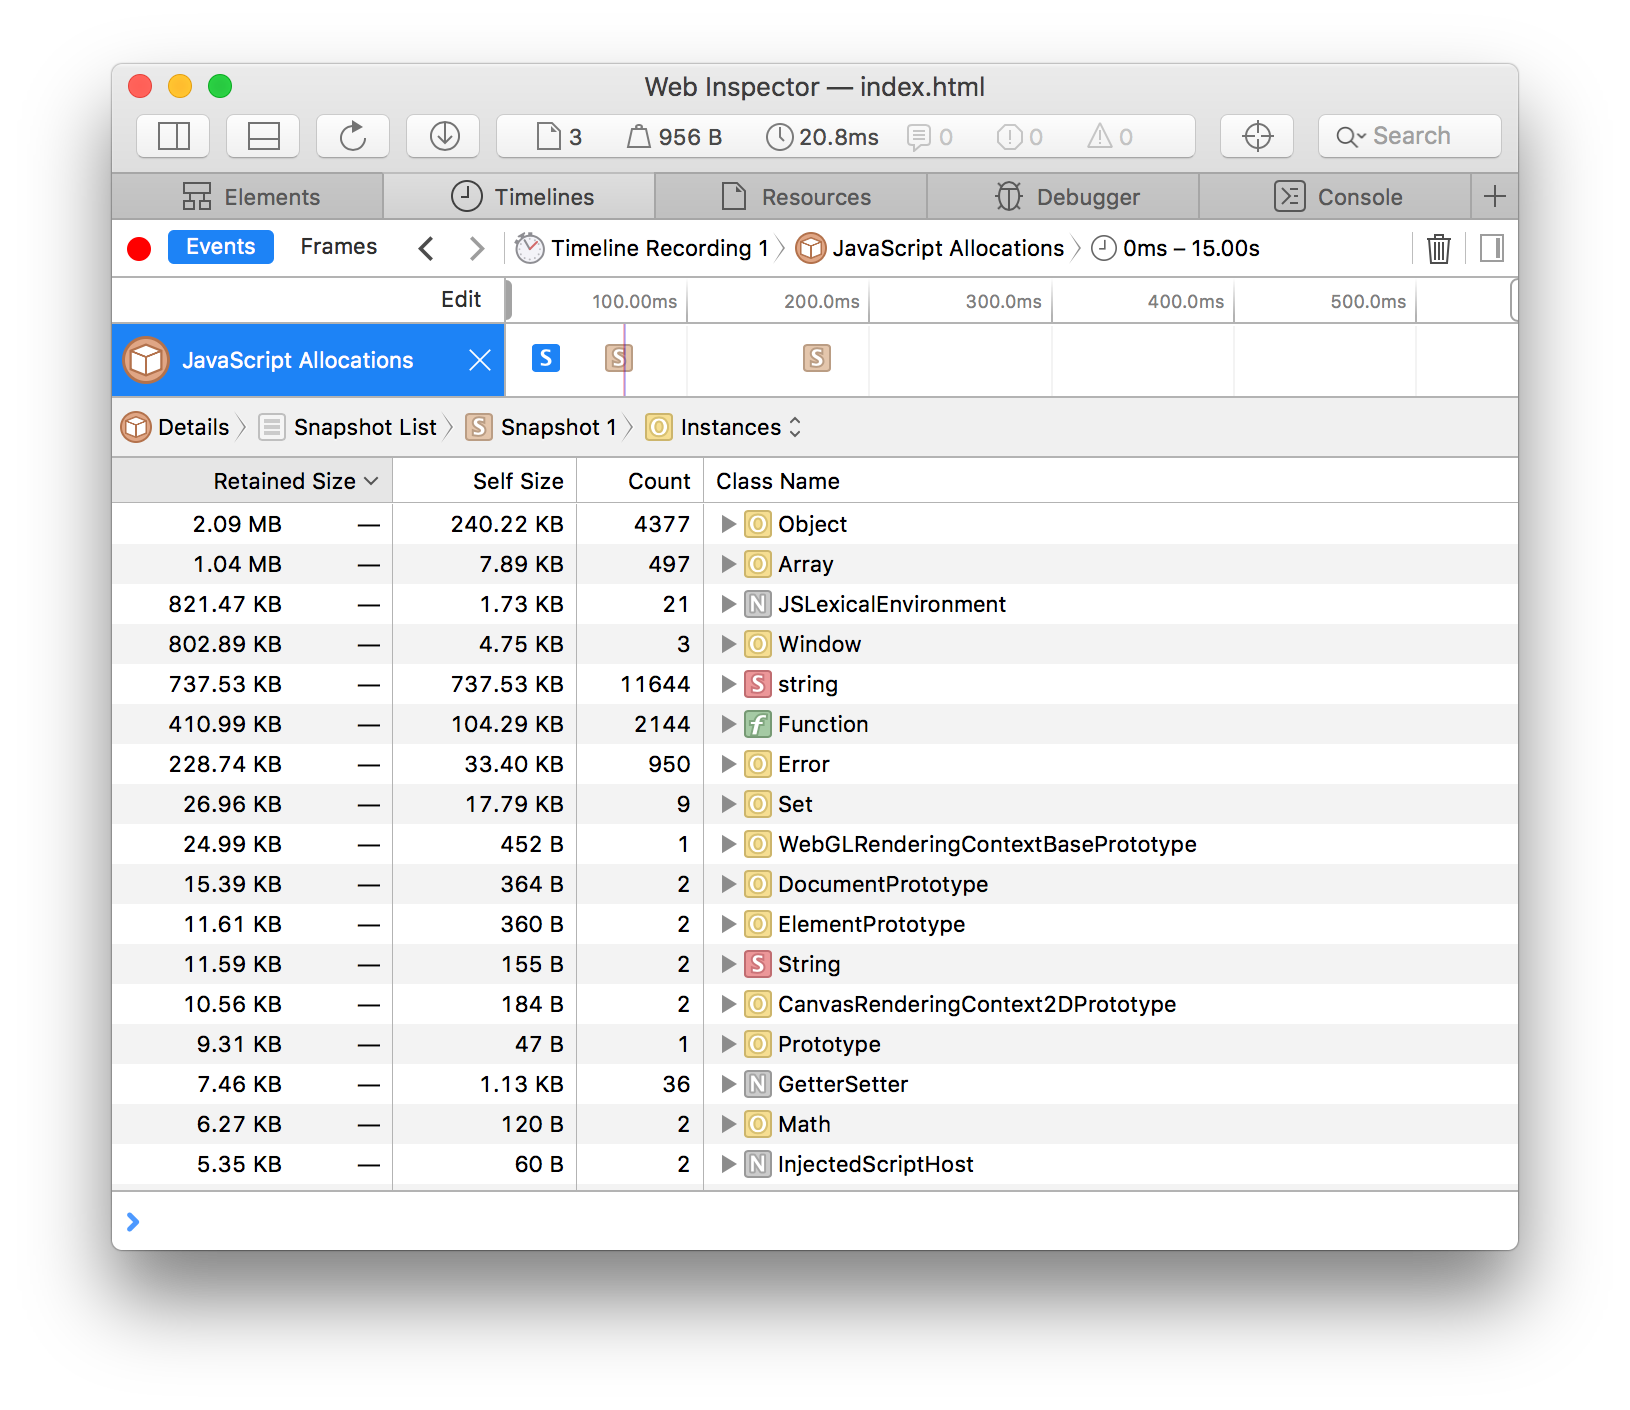
The Instances view is where you will spend most of your time, because it gives you quick access to any object no matter how deep or complex the path to the object may be. Its categorization also makes it easy to recognize potential issues. For example, if you notice that there are multiple XMLHttpRequest or Promise instances but you didn’t expect any such objects to exist, you can immediately investigate them. This view is also ideal for sorting by size, allowing you to quickly focus on the largest objects in a snapshot, which saves analysis time in the case of a group of leaked objects where the larger objects are often the root causes of the leaks.
When expanding an instance, you see the other objects it references. Explicit references, such as a property name or array index, will have a name. Implicit or internal references, such as a closure retaining variables defined in an enclosing scope, will not have a name.
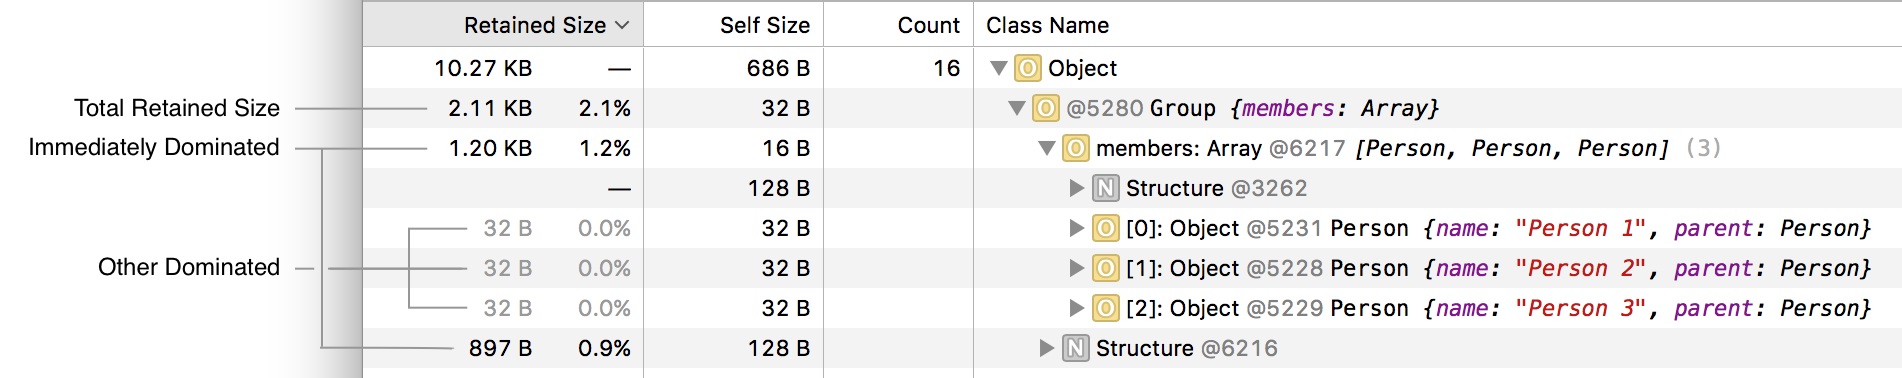
Each instance has two sizes. A self size and a retained size. The self size is only the size of the individual instance. This is normally very small, enough to hold the object’s state. It can be larger for strings and certain system objects representing compiled code. The retained size is the size of the object plus the size of all of the nodes it dominates (the objects that this particular object solely keeps alive). An easy way to think about the retained size is if the object were to be deleted right now, the retained size would be the amount of memory that would be reclaimed. The Mozilla Developer Network (MDN) provides an excellent description of dominators in JavaScript.
After creating a few objects like so:
class Person {
    constructor(name) {
        this.name = name;
    }
}

class Group {
    constructor(...members) {
        this.members = members;
    }
}

let shared = new Person("Shared");
let p1 = new Person("Person 1");
let p2 = new Person("Person 2");
let p3 = new Person("Person 3");
p1.parent = p2.parent = p3.parent = shared;

let group = new Group(p1, p2, p3);
We can find the group object instance, expand it and see the objects it immediately dominates (members array), and if we keep expanding see the other objects it dominates (p1, p2, p3, shared) that ultimately contribute to its total retained size.
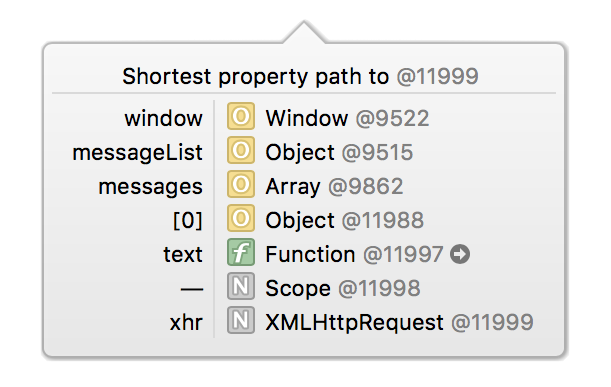
Perhaps the most powerful aspect of the memory tools is being able to determine the path to a particular object, so you can reason about what keeps it alive. When you hover the instance’s unique identifier, you get a popover showing the shortest path from a root to that instance. If you suspect an object should have gone away, this path will be invaluable for understanding why the object is kept alive.
You can click the unique identifier to log the live value to the console so that you can interact with it directly. Also, for functions, you can click the goto arrow to jump directly to the function declaration.
Detecting JavaScript Leaks
Heap snapshot comparisons are an effective technique for detecting leaks and unintended memory growth. The technique is often referred to as generational analysis. Analyzing an individual heap snapshot for leaks would be time consuming, and on pages with a large number of objects, small leaks would be hard to spot. This is where comparisons shine, letting you focus in on just the objects created between two points in time.
Generational analysis works best when comparing two snapshots before and after an operation that you expect to be memory neutral or have minimal growth. For example, showing and hiding a section of the page, creating and deleting a comment, toggling a preference on and off. You would not expect these actions to cause large memory growth. But if you perform them repeatedly and they do, then comparing a snapshot from before and after the operation would reveal created objects that have not been collected and may be leaks.
Put simply, the steps are:
- Get your web application into a steady state.
- Start recording JavaScripts Allocations Timeline.
- Perform actions that are expected to be memory neutral. Take a snapshot each repetition.
- Stop recording.
It is best to repeat the action multiple times and end up with multiple snapshots. Often applications populate caches the first time an operation is performed, or just as likely the JavaScript engine itself may create its own internal objects early on. If you perform the action five times and memory only increased the first time, then there likely isn’t a problem, but if you saw a steady increase each time, then you’ve likely uncovered a leak. This style of analysis works great with console.takeHeapSnapshot() because it makes it easy to control the exact before and after points.
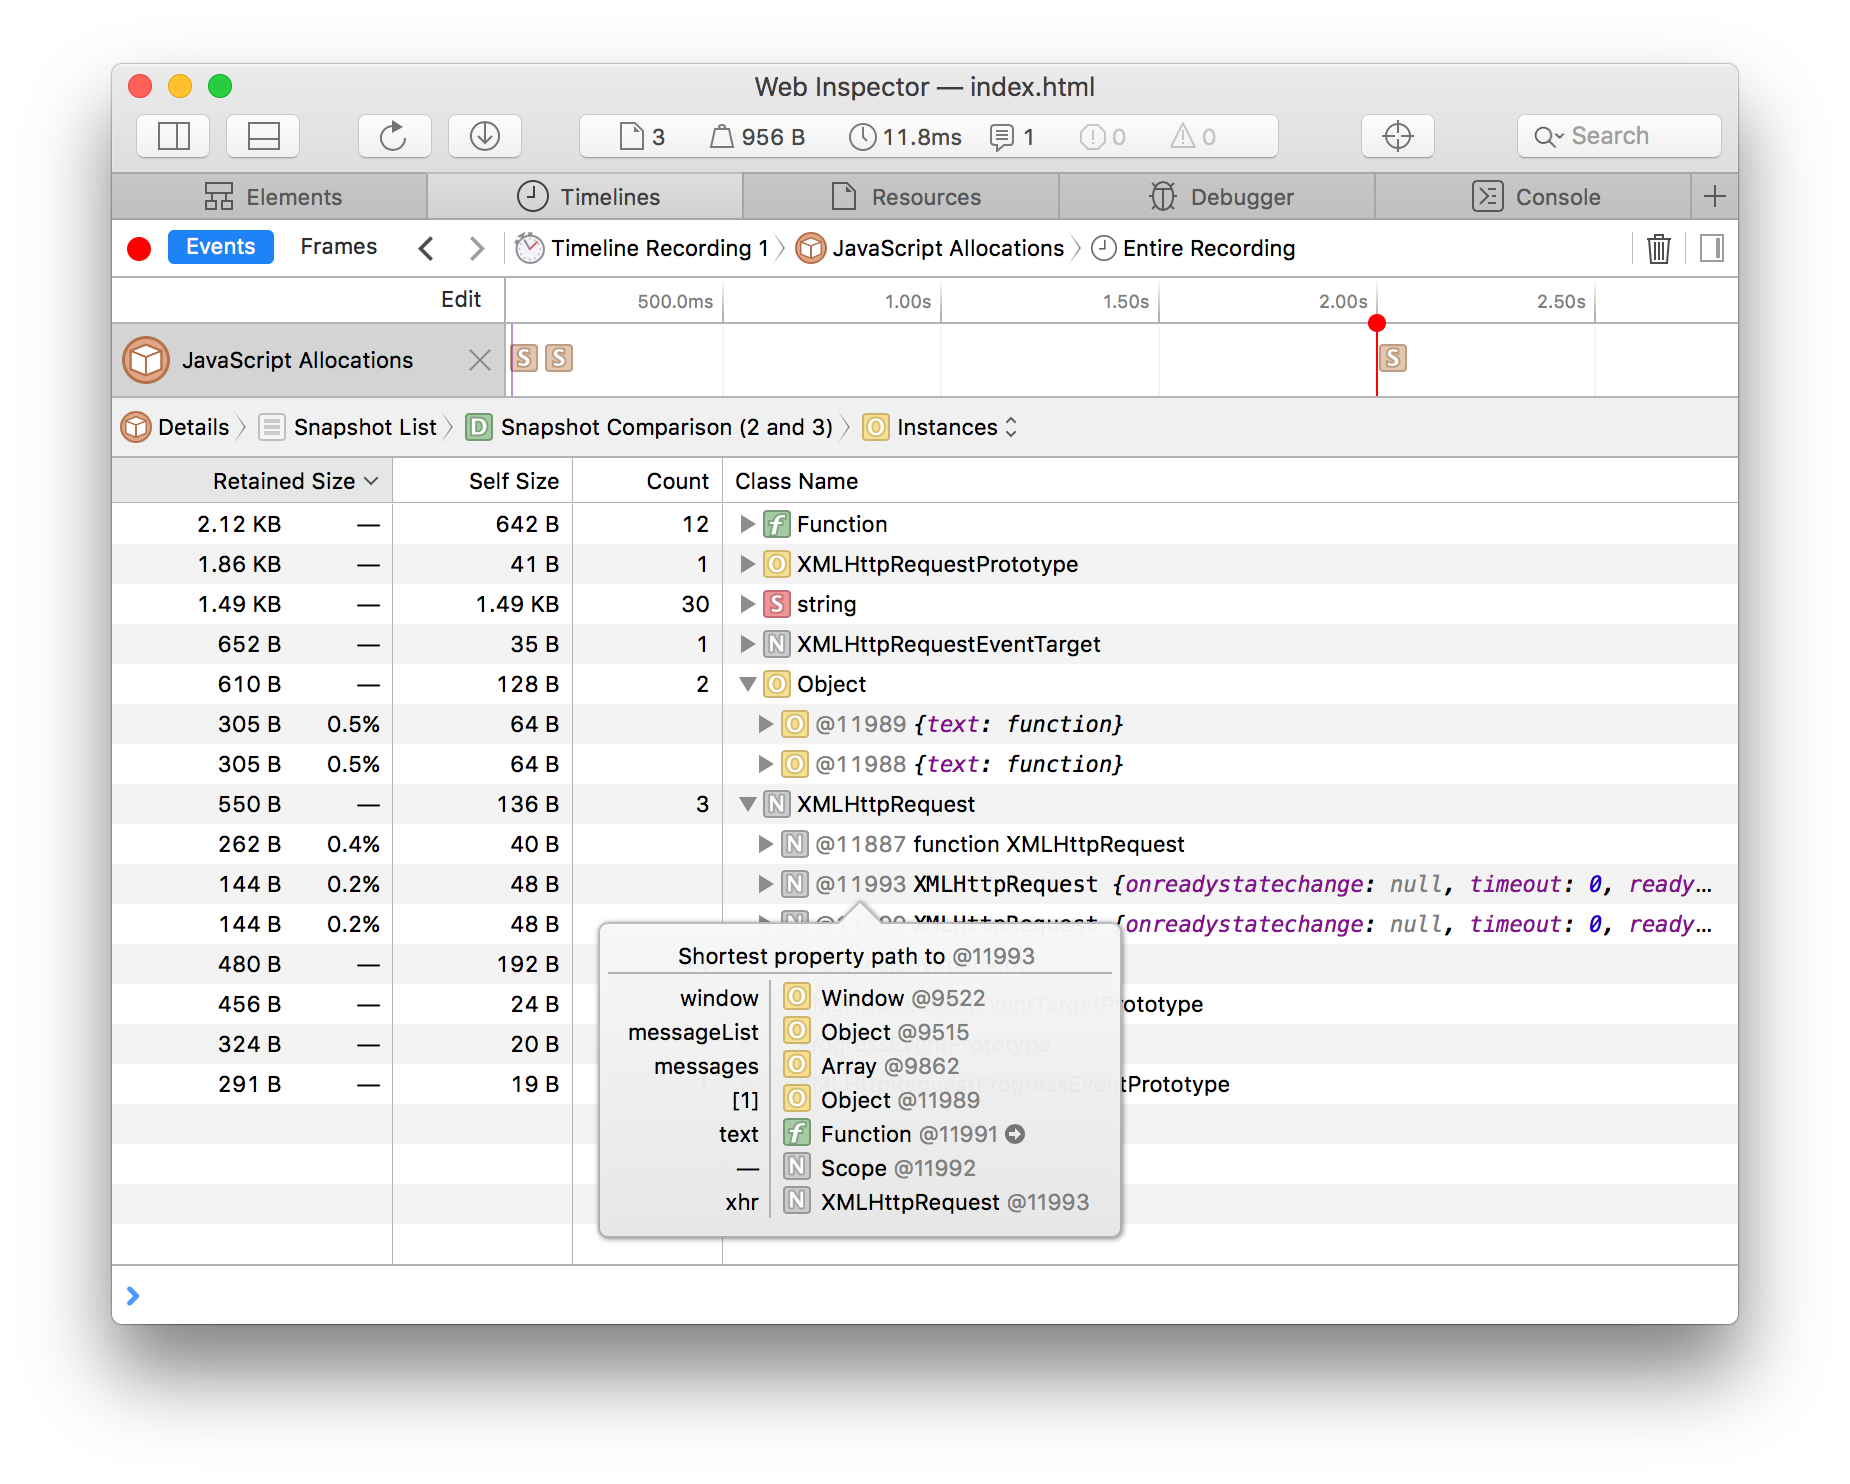
To compare two snapshots start at the snapshot list. Click the Compare button, select a baseline snapshot (before) and comparison snapshot (after) and you get the familiar Instances view for the comparison. The comparison shows only the objects created within that time range that are still alive.
Playing with the example above, it is easy to see that multiple XMLHttpRequest objects are kept alive, see that it is a closure keeping them alive, jump to the function capturing them, and address the issue.


Implementation Details
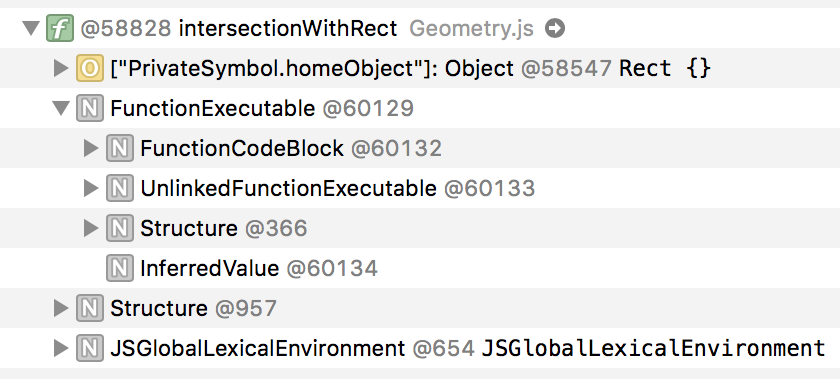
Exposing all of the objects in JavaScriptCore’s heap reveals internal, engine allocated, objects in the heap. These appear as nodes without a preview with names like Structure and FunctionExecutable. We felt it was useful to include these objects to accurately show how they contribute to the retained size of the actual objects exposed to the page. However, keep in mind that their names, and even their existence, is entirely an internal implementation detail that may change. For this reason, the Instances view filters out such objects from the top level categories, allowing you to focus on only the objects you have control over.
In JavaScriptCore, primitive values like numbers and booleans are not allocated as heap objects. Hence, they will not show up in any snapshots. Instead, they are stored as encoded values in JavaScript objects. The string primitive, on the other hand, is allocated as a heap object, and will show up in snapshots. You can always log a live value to the console and see all of its properties and values.
We took great effort in keeping the memory and performance costs of snapshots to a minimum. After all, if you are debugging a memory issue you don’t want the memory tools introducing more memory pressure. However, you should be aware that debugging both memory and performance at the same time won’t be as accurate as measuring either of them individually. Web Inspector has the ability to let you turn on and off individual timelines to get the most accurate recording possible.
Like other potentially expensive console APIs, console.takeHeapSnapshot does nothing unless Web Inspector is open. That said, it is always best practice to avoid including unnecessary debug code in production.
Feedback
You can try out the new Memory Timelines in the latest Safari Technology Preview. Let us know how they work for you. Send feedback on Twitter (@webkit, @JosephPecoraro) or by filing a bug.