Unusual Speed Boost:
Binary Size Matters
One of my concerns last year was that while WebKit was getting faster on common benchmarks, some operations were getting slower as a byproduct of new features and optimizations.
WebKit is a fast-moving project, you see new features and optimizations coming daily. A consequence of most of those changes is a rapidly increasing binary size. But does binary size really matter? On a patch-by-patch basis, the growth is harmless and barely detectable. But give it a few months, and you’ll have thousands of patches which together aggregate to a heavier, slower engine.
The following chart shows the evolution of WebCore’s binary size last year. It took about 1.5 months to grow an extra megabyte

The growth of WebKit’s binary size affects speed in 3 ways: memory locality, startup time and memory use.
The memory locality of the instructions affects the CPU caches; the more the code is spread out, the more time the CPU cores are waiting for something to do. Typically, we want to reduce the number of cache misses, being from the instruction-cache, TLB, page faults, etc. Since cache sizes and memory speeds do not increase as fast as our binaries are growing, we cannot count on new hardware to compensate. We need to address the issue in software.
Startup time is impacted by two factors: the most important is loading the binary from disk (which is really slow compared to the speed of a CPU). Memory locality also comes into play because all the caches are cold.
Memory use is quite direct, the more code required by WebKit, the more instructions page loads take place. The memory footprint of the binary is a relatively minor problem; everything isn’t wired into real memory all the time, and a few megabytes increase is a small amount compared to how much memory is used by modern web pages.
How do we fix that? No two patches have been much alike, so I’ll discuss three of the bigger principles below.
Better Code
Interestingly, we discovered that in some cases the compiler was doing a “bad job” because the C++ code was preventing the compiler from optimizing. This typically happens when developers try to save a few lines of code instead of writing more explicit algorithms.
A small artificial example will illustrate this better than an explanation. Let’s take the following code:
inline void updateCachedWidth() {
    m_cachedWidth = computeWidth();
    m_cachedWidth *= deviceScaleFactor();
}
From this, the compiler will generate something like:
call computeWidth()
store the result at the address of m_cachedWidth
call deviceScaleFactor()
load m_cachedWidth from its address
multiply the two values
store the result at the address of m_cachedWidth
You may wonder: why is the compiler storing the value in the middle instead of keeping it in a register? This is a common problem: the compiler doesn’t know if the function call will cause m_cachedWidth to be modified, therefore it must re-load the value from memory instead of keeping it in the register.
With a tiny modification:
inline void updateCachedWidth() {
    double newWidth = computeWidth();

    newWidth *= deviceScaleFactor();
    m_cachedWidth = newWidth;
}
We get what we expect:
call computeWidth()
keep the result in one available register.
call deviceScaleFactor()
multiply the result with the value in register
store the result at the address of m_cachedWidth
Inline Functions
Inline functions are one of the greatest tools for performance, yet one of the most dangerous.
On one hand, inlining gets rid of the register spilling and a jump. This means better register allocation, fewer branches for the CPU to track, more optimization opportunities, etc. When the inlined code is small, the resulting binary is both smaller and more efficient.
On the other hand, if the inlined code is larger than the calling overhead, we end up with bigger binary and the result may or may not be faster than the non-inlined code.
Inlining bigger functions is walking on eggs, you always run the risk of blowing up the instruction cache and making the program much slower than it could be.
There appears to be some tendency to over-inline code to get rid of functions on profilers. While this works great on powerful development computers with huge CPU caches, it does not always fare so well on laptops and embedded systems. It’s also hard to investigate since the problem doesn’t show so clearly in profilers.
Excessive inlining was addressed in two ways. First, for smaller inline functions that are widespread, we worked hard on making them smaller by using different instructions or changing the way their algorithm works. For the bigger functions, we either uninlined them, or split them into a hot inline path and a colder out-of-line function.
Static Initializer
Static variables were sometimes costing a lot in binary size without helping the performance at runtime.
Let’s take a simple example:
Object* someObject()
{
    static Object* someObject = new Object();
    return someObject;
}
Which translates into these ARM Thumb instructions:
__Z10someObjectv:
00000ef8        b5b0    push    {r4, r5, r7, lr}
00000efa    f2401510    movw    r5, 0x110
00000efe        af02    add r7, sp, #8
00000f00    f2c00500    movt    r5, 0x0
00000f04        447d    add r5, pc
00000f06        7828    ldrb    r0, [r5, #0]
00000f08        2801    cmp r0, #1
00000f0a        d106    bne.n   0xf1a
00000f0c    f24000fc    movw    r0, 0xfc
00000f10    f2c00000    movt    r0, 0x0
00000f14        4478    add r0, pc
00000f16        6804    ldr r4, [r0, #0]
00000f18        e00d    b.n 0xf36
00000f1a        2008    movs    r0, #8
00000f1c    f000e834    blx 0xf88
00000f20        4604    mov r4, r0
00000f22    f7ffffb3    bl  __ZN6ObjectC1Ev
00000f26    f24000de    movw    r0, 0xde
00000f2a        2101    movs    r1, #1
00000f2c    f2c00000    movt    r0, 0x0
00000f30        7029    strb    r1, [r5, #0]
00000f32        4478    add r0, pc
00000f34        6004    str r4, [r0, #0]
00000f36        4620    mov r0, r4
00000f38        bdb0    pop {r4, r5, r7, pc}
Pretty crazy huh? The code first checks if the object is initialized, then loads the address or initializes the memory (and the object) depending on the results.
Many statics in WebKit exist for good reason – they are objects that need to stick around for the lifetime of the process. But some have been added just for convenience, and we strive to replace those with more straightforward use of the memory.
End Results
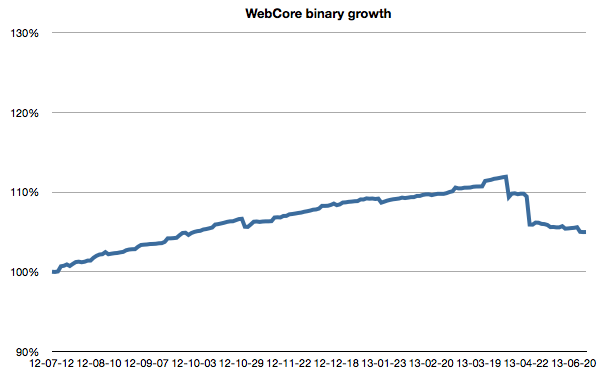
With the tools in hand, we had a pretty good run at improving the code. As we have seen before, WebCore was the worst offender, let’s see how its size evolved over the last year:

The first month is the uncontrolled growth presented in the introduction. After that the growth slows down as various refactoring introduce dents in the chart. Most of the improvements coming out of those refactoring were quickly overturned by the natural growth of WebCore.
Mid-April, things starts to get serious. There are two majors dents. The first one is the result of several improvements to inlining. The second big drop is the result of removing features and cleaning code that came from the Chromium project.
After that we see a downward trend as engineers better balance code improvements with new features.
Keep in mind that many people were busy adding new features the whole time. Some parts of WebCore grew significantly, others shrank to compensate.
WebKit had some less dramatic changes:

The WebKit library is smaller to begin with. The big drop in October is the result of enabling C++11 by default. Some refactoring allowed the removal of some Objective-C code, but overall changes were quite small.
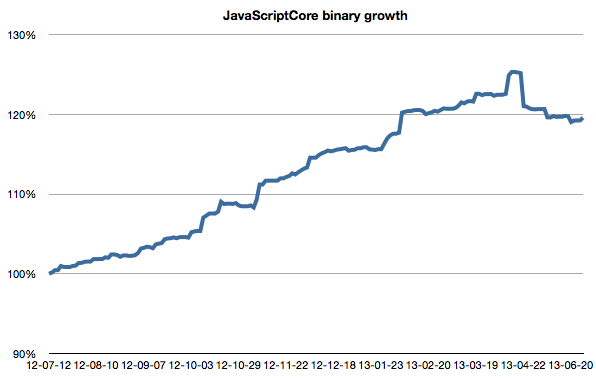
JavaScriptCore had a steady growth over the last year:

JavaScriptCore gained a lot of new optimizations from the optimizing JIT tier which caused its binary to slowly grow.
Conclusion
Binary size is only an indirect indicator of the overall performance, but looking at it sometimes helps to find big issues that were hidden by the translation from the algorithm in C++ to the machine code.
From the last few months, we at least got some guidelines for future code to avoid blowing up the binary size:
- Try to be explicit in your coding to help the compiler understand what you are doing.
- Carefully consider whether you should be inlining large blocks of code.
- Do not use static initializers for code that is run infrequently and/or have trivial initialization.
Any good binary optimization story? Send it my way to @awfulben.