Web Inspector User Interface Changes
Quickly switching tasks is a common action when developing a web site. You might be debugging JavaScript one minute — the next minute you might be poking around in an XHR to validate server data. A designer might only care about the DOM tree and CSS editing. A backend developer might only need network information and a console. Making sure these task areas are quick to access is key for a tool containing such broad functionality.
Catering to these disparate tasks, each of Web Inspector’s core functions have been divided out into their own tabs. Like the tabs in Safari, they can be rearranged to fit your workflow and closed if you don’t need them. Quickly switch among tasks for Network, Elements, Timelines, Console, Debugger, Resources, Storage, and Search Results with this flexible tab-based interface.
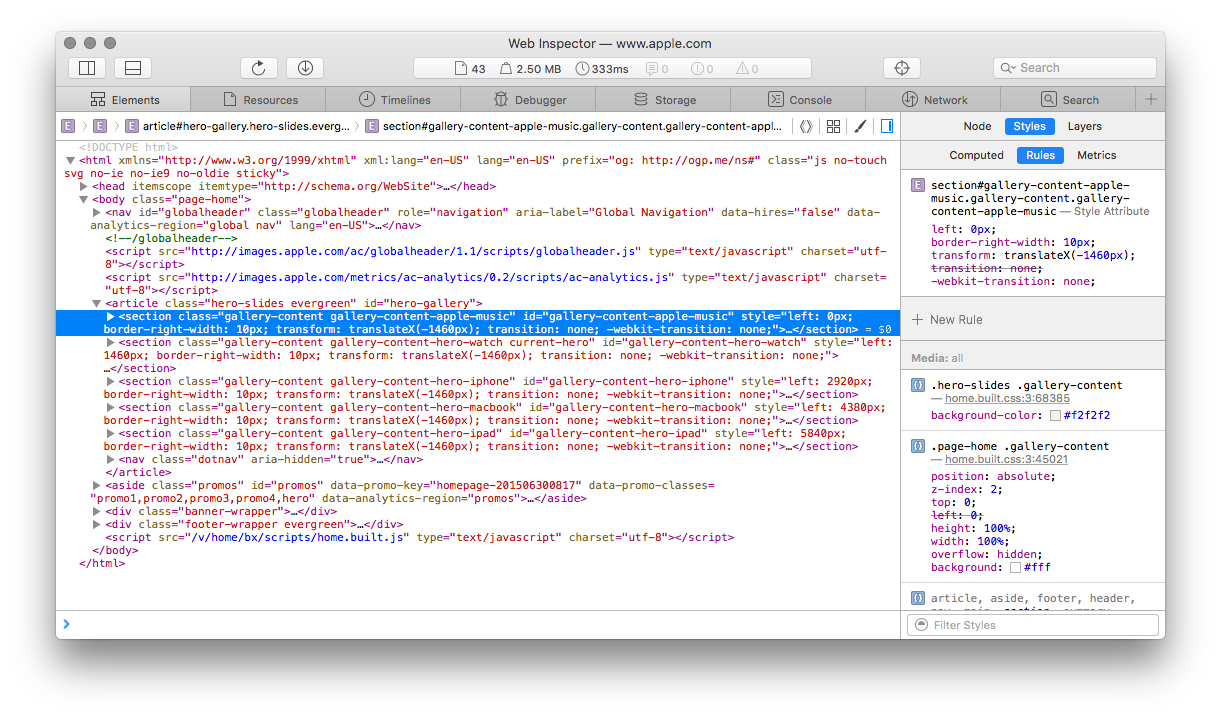
The everyday tasks of manipulating a page’s DOM tree and styles are now contained in the dedicated Elements tab. New improvements to our style editing experience also help you to stay productive.
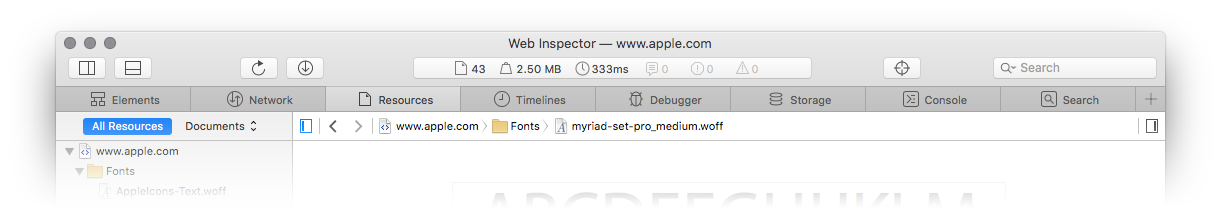
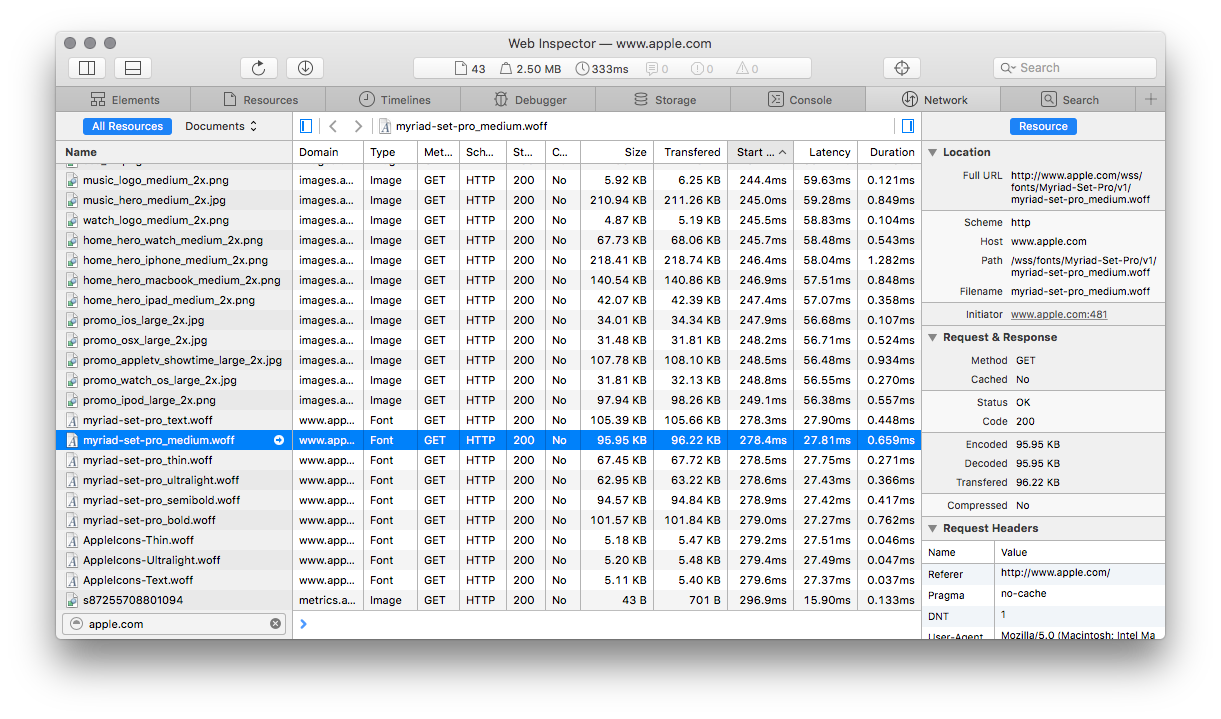
You can stay on top of resource requests in the Network tab — allowing for continuous network request monitoring, without the overhead of a full timeline recording. It includes filterable access to all resource requests and XHRs, along with a details sidebar for quick-hit information about individual requests and the server responses.
These enhancements are available to use in WebKit Nightly Builds and the Safari 9 beta. Help us make Web Inspector even better by sending us quick feedback on Twitter (@xeenon, @jonathandavis, @JosephPecoraro), file a bug report, or even contributing your own enhancements to Web Inspector. For more information about other Web Inspector changes, please watch Using Safari to Deliver and Debug a Responsive Web Design from WWDC 2015.