JavaScript Type and Code Coverage Profiling
Web Inspector now has two great tools designed to make debugging JavaScript programs easier: the Code Coverage Profiler and the Type Profiler. The Code Coverage Profiler visually displays exactly which sections of your JavaScript program have executed. The Type Profiler visually annotates important variables with the collected set of type information for those variables. Both tools make understanding and debugging your JavaScript programs in Web Inspector better than ever.
Code Coverage Profiling
Understanding how a program works can be complex and complicated. Being able to grasp how a program works requires understanding which parts of the program execute based on a set of input data. In web applications, we’re often interested in knowing which parts of a program execute based on a user’s interaction with the web page. Web Inspector now has a way to show you exactly which parts of your program have run, and which haven’t.

Knowing exactly which functions have executed, and even which if-then branches inside those functions have executed, is imperative in understanding the inner workings of your program’s control flow. Knowing when something has or has not executed gives you important insight into finding bugs and understanding how a program’s different pieces fit together. Web Inspector’s Code Coverage Profiler will tell you which portions of your program have executed up to basic block granularity.
One subtle detail you can see while watching this video is that the comments describing left and right are swapped. The Code Coverage Profiler a great tool for finding subtle mistakes in your program and your program’s documentation.
Type Profiling
One of the coolest new features in Web Inspector is the JavaScript Type Profiler. All values in JavaScript have a type, but, just by reading a JavaScript file or function, it’s hard to know what type everything will be. We created the Type Profiler because we no longer want to read JavaScript programs without knowing what type important variables have.

JavaScript is a dynamically typed language. This means that JavaScript programs are written without any type declarations. Any variable in any JavaScript program can have any type; expressions can have any type; any function can return any type; the list goes on. For example, the following is a legal JavaScript program:
let x = 20;
print(x);
x = ["Hello", "World", "I am the Type Profiler"];
print(x);
const identity = (x) => { return x; };
identity(10);
identity([1, 2, 3]);
identity("Saam Barati");
This is in contrast to a statically typed language like Swift or Haskell. Statically typed languages prevent you from mixing mismatched types. The compiler won’t let you run a program that fails its type checker. JavaScript doesn’t have this restriction. As long as a program doesn’t have a syntax error, it will run. For example, in a statically typed language, you can’t assign a number to a variable of type Array. JavaScript has no such restrictions.
This trivial example of a type mismatch seems easy enough to prevent. However, as your JavaScript program grows larger and the number of classes increases, it becomes untenable to keep track of all possible types and prevent their misuse. Even though JavaScript is not statically typed, variables in a JavaScript program are often intended to only have a particular type (this tendency towards monomorphism is a big part of why JIT compilers are successful at optimizing JavaScript programs). For example, consider this program:
function add(a, b) {
    return a + b;
}
The above function may have been written with the intention that a and b are both numbers. When a and b are both numbers, this function will behave as expected. For example:
add(10, 20) === 30
However, it begins to do weird things if it’s called with parameters that have an unintended type. For example:
add(10, "20") === "1020"
add([1, 2], undefined) === "[1,2]undefined"
The resulting values are weird and unexpected, but also totally valid according to the JavaScript spec. Even though the intention of the programmer is that the add function is to only be called with numbers, there is no easy and straightforward way to enforce this. Because type safety is hard to enforce, JavaScript programs often have bugs due to unexpected types leaking into places they were not meant to be. Web Inspector’s Type Profiler makes finding and debugging such problems easier than ever.
Sometimes type-related bugs are easy to diagnose, a mismatched type may throw a runtime TypeError. At other times, though, such problems won’t throw a TypeError and will result in subtle bugs that are difficult to diagnose and may only arise in rare situations.
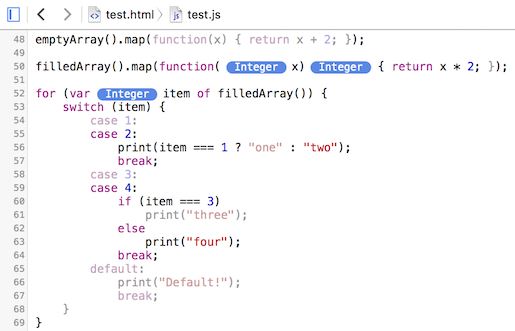
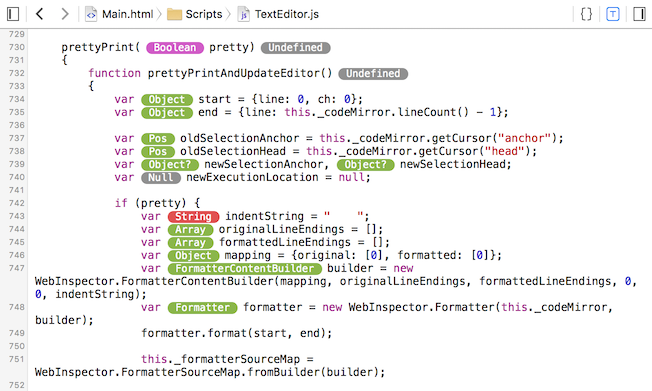
Web Inspector’s Type Profiler helps you to find these subtle bugs. When using Web Inspector with the Type Profiler enabled, your JavaScript program will have type annotations next to important variables and function return types.

This allows you to visually inspect types in your JavaScript program without needing to insert console.log statements or pause in the debugger. console.log and the debugger are important debugging tools, but the Type Profiler is great for finding type-related bugs retroactively. The Type Profiler does what its name indicates: it profiles the types of values in your program. This means the information it shows you is only ever the types that have flowed through your program. It neither shows you the types something could be (which could be anything in JavaScript, this wouldn’t be helpful) nor does it infer what type something would be based on the information it already has.
The Type Profiler updates in real time. As new information is introduced in your program, the Type Profiler updates its annotations. As you see in the video, when the announceAnimal function is called a second time, the type displayed for the animal parameter updates from Dog to Animal. This happens because the Type Profiler tracks the inheritance chain for values it profiles. The Type Profiler also shows other aggregate types in an intelligent way. As you use the Type Profiler, you’ll see that the types it shows you are both intuitive and helpful.
The Type Profiler is also a great form of documentation. Using the Type Profiler will help you familiarize yourself with new code. Seeing type annotations while reading unfamiliar code makes understanding that code much easier. It also helps you better understand how your own code behaves.

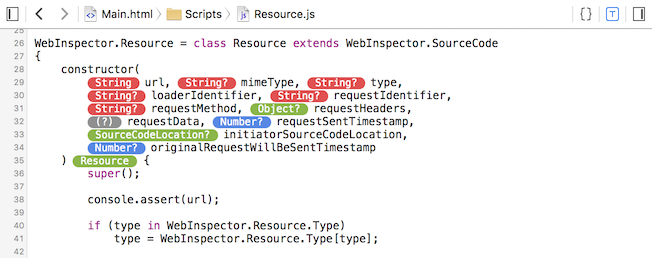
You can see in the above image that the Type Profiler will display type names as String? and Number?. The Type Profiler is great at displaying optional parameters. Any [Type] mixed with Undefined or Null will show up as [Type]?. The Type Profiler will also recognize when a cohesive type name would be deceptive. This may happen when many unrelated types are assigned to the same variable, passed as an argument, or returned from a function. In this situation, the Type Profiler will display the type name as (many). When encountering (many), just hovering the type token will give you information about all the types that constitute that (many).
A Note on Compilation
Implementing a type profiler in a naive way would not be terribly difficult. You could imagine a naive implementation that works by rewriting JavaScript source code using [abstract syntax tree](https://en.wikipedia.org/wiki/Abstract_syntax_tree “Abstract Syntax Tree”) transformations and wrapping the necessary language constructs with the required type profiling code. However, such an implementation would suffer from being unusably slow. It would probably incur a 20x slowdown if not more. When developing the Type Profiler, we set out to optimize its overhead as much as possible. On average, the Type Profiler will slow down JavaScript code by 2x.
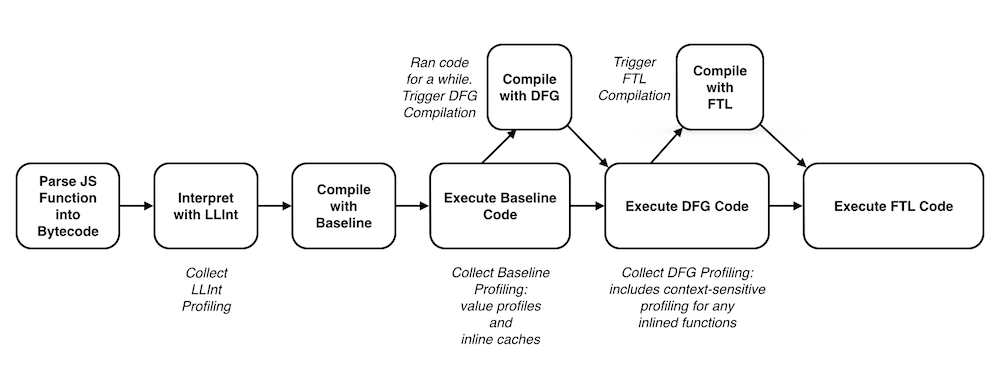
This means that the Type Profiler is deeply integrated with JavaScriptCore’s JIT compilation infrastructure. Here is a quick overview of how JavaScriptCore’s (JSC) compiler pipeline works.

JSC first parses JavaScript text into an abstract syntax tree (AST). From this AST, JSC generates bytecode. This bytecode is a way of representing JavaScript operations at a lower level. The bytecode is not at such a low level that the original program is difficult to decipher from the bytecode. JSC will then interpret this bytecode and collect profiling information inside JSC’s Low Level Interpreter (LLInt). If a particular function has executed enough times, JSC will do a straightforward compilation of this bytecode into machine code inside JSC’s Baseline JIT. If this function continues to execute many times, JSC will compile it using its optimizing DFG and FTL JITs.
Let’s walk through an example of a JavaScript function and look at its corresponding bytecode representation:
function add(a, b) {
    return a + b;
}
JSC bytecode:
function add: 10 m_instructions; 3 parameter(s); 1 variable(s)
[ 0] enter
[ 1] get_scope       loc0
[ 3] add             loc1, arg1, arg2
[ 8] ret             loc1
This bytecode is straightforward. It says add the two parameters of the function together, store them in loc1, then return loc1. To see how the Type Profiler changes JSC’s bytecode, let’s see the same function’s bytecode with the Type Profiler enabled. (Comments added inline to describe what the Type Profiler is doing.)
function add: 40 m_instructions; 3 parameter(s); 1 variable(s)
[ 0] enter
[ 1] get_scope         loc0

// Profile the parameters upon entering the function.
[ 3] op_profile_type   arg1
[ 9] op_profile_type   arg2

// Profile the operands to the add expression.
[15] op_profile_type   arg1
[21] op_profile_type   arg2
[27] add               loc1, arg1, arg2

// Profile the return statement to gather return type information for this function.
[32] op_profile_type   loc1
[38] ret               loc1
Because the type profiling machinery is compiled into JSC’s bytecode, JSC is then able to utilize its multi-tiered compiler infrastructure to optimize the overhead of type profiling. JSC’s DFG JIT is able to successfully optimize JavaScript code in large part due to the tendency that most JavaScript code is written with specific types in mind. Because of this, the DFG JIT can speculatively transform its IR based on gathered profiling information. Then, when executing this speculative code, if it finds that an assumption is broken at runtime, the DFG will OSR exit back into JSC’s baseline JIT. The bytecode operation op_profile_type is a very expensive operation and it appears with high frequency when the Type Profiler is enabled. When we transform this bytecode operation into DFG IR, we’re often able to optimize away the overhead of ProfileType by completely removing it from the executing code. We’re able to do this because by the time we decide to DFG compile the bytecode stream, it is likely that the types which were profiled in the Baseline JIT and the LLInt are the same types that the DFG will speculatively compile against. For example, if an op_profile_type operation has already observed a value with type Integer, it does not need to observe this type again because doing so adds no new information. If the DFG speculates that the type of a node is an Integer, and the type profiling information already associates this node with an Integer, then the DFG will remove the ProfileType node altogether. If this assumption is ever broken at runtime, the DFG will exit into the baseline JIT where this new type information will be recorded. As an example, here is the same add function represented using DFG IR at the time when bytecode IR is translated into DFG IR.
0:  SetArgument(this)
1:  SetArgument(arg1)
2:  SetArgument(arg2)
3:  JSConstant(JS|PureInt, Undefined)
4:  MovHint(@3, loc0)
5:  SetLocal(@3, loc0)
6:  JSConstant(JS|PureInt, Weak:Cell: 0x10f458ca0 Function)
7:  JSConstant(JS|PureInt, Weak:Cell: 0x10f443800 GlobalScopeObject)
8:  MovHint(@7, loc0)
9:  SetLocal(@7, loc0)
10: GetLocal(JS|MustGen|PureInt, arg1)
11: ProfileType(@10)
12: GetLocal(JS|MustGen|PureInt, arg2)
13: ProfileType(@12)
14: ProfileType(@10)
15: ProfileType(@12)
16: ValueAdd(@10, @12, JS|MustGen|PureInt)
17: MovHint(@16, loc1)
18: SetLocal(@16, loc1)
19: ProfileType(@16)
20: Return(@16)
There are still a lot of ProfileType operations in this IR. And these operations have the potential to be really expensive. However, the DFG speculates that the arguments to this function are integers. Because of this, the DFG IR at the time of generating machine code is able to remove all ProfileType operations under the speculative assumption that this function has integer arguments.
1:  SetArgument(arg1)
2:  SetArgument(arg2)
3:  JSConstant(JS|PureInt, Undefined)
4:  MovHint(@3, loc0)
7:  JSConstant(JS|PureInt, Weak:Cell: 0x10f443800 GlobalScopeObject)
8:  MovHint(@7, loc0)
10: GetLocal(@1, arg1)
12: GetLocal(@2, arg2)
16: ArithAdd(Int32:@10, Int32:@12)
17: MovHint(@16, loc1)
20: Return(@16)
Without optimizations like these, it would be unusably slow to use the Type Profiler while debugging your code.
If you’re interested in learning more about the Type Profiler, Code Coverage Profiler, or contributing to JSC or WebKit, please get in touch: @saambarati. There is a lot of interesting work still to be done and I’d be happy to point you in the right direction. You can also get in touch with @jonathandavis with any other questions and comments.