Breakpoint Options
In his classic book on graphics and assembly language, Michael Abrash writes, “the best optimizer is between your ears”. The best debugger is also between your ears, and the best development tools should provide powerful and flexible features to help developers to analyze program flow and locate errors.
Web Inspector provides a number of options for customizing breakpoints, many of which will be familiar to users of modern IDEs like Xcode and Microsoft Visual Studio. This post will focus on the Debugger tab, customizing breakpoints with conditions and actions for logging and executing scripts, and creating probe expressions.
The Debugger Tab
The debugger tab’s left sidebar lists breakpoints by source file, including two global breakpoints for pausing automatically whenever an exception is thrown.
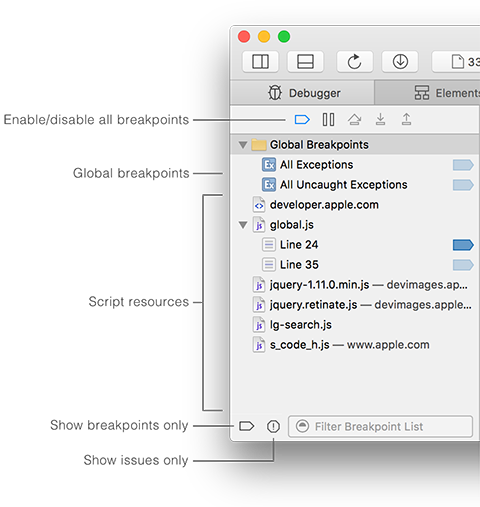
The following options are provided for filtering the breakpoint list:
| Enable/disable all breakpoints | ⌘Y | Toggle all breakpoints on or off, including global breakpoints |
| Breakpoint filter | Only show scripts with breakpoints | |
| Issues filter | Only show scripts with exceptions, console errors, and warnings | |
| Text filter | Only show files matching the filter text |
A breakpoint’s color in the sidebar or text editor reflects its current state:
| Enabled | Default | |
| Auto-continue | Breakpoint will not pause the debugger when evaluated | |
| Disabled | Breakpoint will not be evaluated | |
| Inactive | Unresolved breakpoint, or all breakpoints disabled |
Right-clicking a breakpoint in the sidebar or source code view’s gutter opens the breakpoint editor. From here we can customize the runtime behavior of breakpoints by setting conditions and actions.
Conditional Breakpoints
A conditional breakpoint is only triggered when the specified conditional expression evaluates to true. The expression is evaluated in the breakpoint’s scope. The condition field supports autocompletion for JavaScript built-in types.
Breakpoint evaluation can also be controlled by setting an ignore count, causing the debugger to ignore the breakpoint a number of times before stopping. Both are useful when debugging code which runs inside a loop, and event callbacks that fire frequently.
If both an ignore count and conditional expression are specified, the ignore count takes precedence. To demonstrate, consider the following breakpoint in the body of a loop:
for (var i = 0; i < 10; ++i) {
   // do some work
}
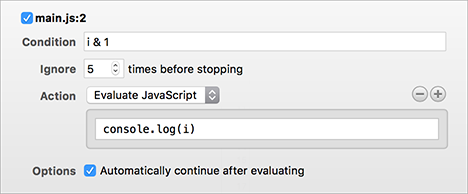
The breakpoint action is triggered for odd values of i, starting with the sixth loop iteration. Running the program results in the following console output:
5
7
9
Breakpoint Actions
Stopping script execution to inspect program state isn’t always practical. Repeatedly pausing in the debugger can be distracting, and when debugging mouse event handlers or asynchronous callbacks it may even introduce unexpected program behavior. Instead of simply pausing the current script, breakpoints can run one or more actions when triggered.
- Right-click the breakpoint and choose
Edit Breakpoint - Click Add Action
- Set the new action’s type
- Set to automatically continue to avoid pausing in the debugger
- Optional. Add additional actions
The following actions are available:
| Log Message | Default. Log a plain text message to the console |
| Evaluate JavaScript | Execute custom JavaScript directly in the inspected page |
| Play a Sound | Beep |
| Probe Expression | Sample the value of an expression |
Evaluate JavaScript
The Evaluate JavaScript action is a powerful and flexible tool. Like conditional expressions, the script action has access to any variables, functions, and objects in the breakpoint’s scope. Script actions are often used to log data to the console, but they can do much more.
Script actions can be used to modify program state at runtime, output the current call stack, measure execution time, and even record timeline profiles. The Console API contains many functions that are well-suited for these tasks:
console.log(a, b, ...) |
Output arguments to the Console |
console.profile(name) |
Start profiling (creates a timeline recording) |
console.profileEnd() |
Stop profiling |
console.table(object) |
Output an object to the Console, formatted as a table: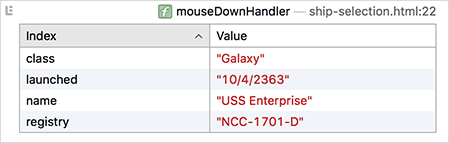
|
console.time(name) |
Start a timer |
console.timeEnd(name) |
Stop a timer, output timestamp to the Console |
console.trace() |
Output the call stack to the Console: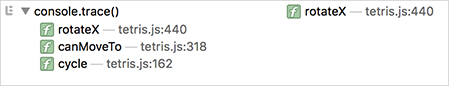 |
Probe Expressions
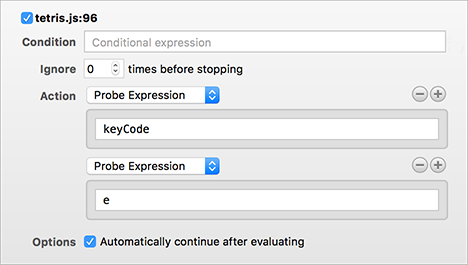
Probe expressions make it easy to observe state changes in an interactive program, without being interrupted by the debugger or sifting through console output. Adding a Probe Expression action creates a Breakpoint Probe, which can contain multiple expressions.
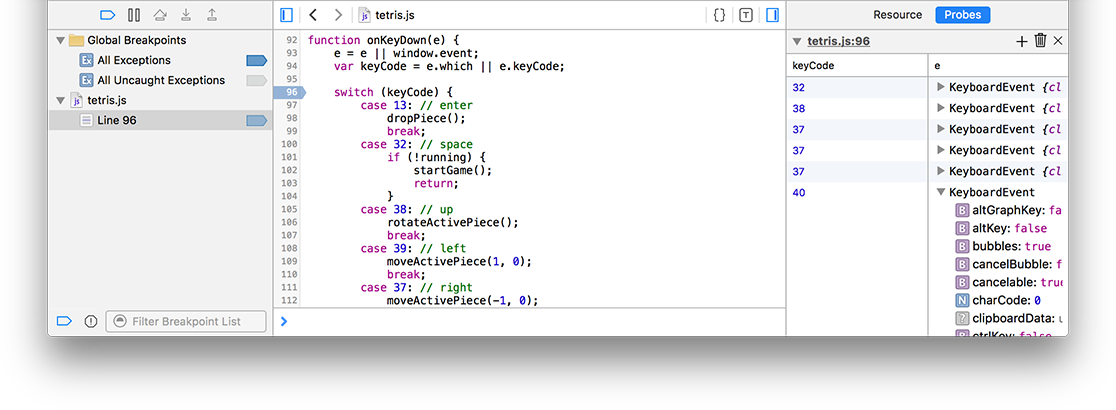
In the example below, a breakpoint with two probe expressions has been added to the keydown handler in a Tetris game:
After creating the breakpoint, a Probes panel is added to the debugger’s right sidebar. Probe samples are added to the data table at runtime each time the breakpoint is evaluated:
Probes can be edited directly from the sidebar, without opening the Edit Breakpoint dialog. Each probe’s entry in the sidebar panel has a toolbar with the following commands:
| Add a new probe expression (creates a breakpoint action) | |
| Clear probe samples | |
| Delete the probe (removes associated breakpoint actions) |
Conclusion
The Debugger sidebar is under active development, and we’re currently exploring new ways of organizing breakpoints to make debugging workflows smoother.
The latest features and enhancements can be found in WebKit Nightly Builds. Help us make Web Inspector even better by sending us feedback on Twitter (@xeenon, @jonathandavis, @matt_a_baker), or by filing a bug.