Canvas Debugging
Ever since its introduction in 2004, the Canvas element and its associated APIs have been an incredible tool for generating specific visual effects on a webpage. As more technologies, such as WebGL, came into being, Canvas’ complexity grew, and more was expected of the developer. For many years, debugging Canvas issues was a process of adding console.log statements, or even overriding the prototype of the Canvas’ context to better understand when functions are being called. Today, we’re excited to tell you about our improvements to the debugging process for Canvas, specifically the ways in which we are providing in-depth insight into the cause and effect of every action, as well as exposing in-process information that was previously invisible.
Canvas Tab
Web Inspector now has a dedicated Canvas tab for debugging canvas contexts. This new tool makes it easier to diagnose performance and correctness problems in canvas drawing code without having to manually instrumenting your code. The rest of this post explains these new capabilities.
Visualizing Canvases
The Canvas tab overview shows all active canvas contexts, listing the type of drawing context, preview image, dimensions, and current memory usage for each canvas in the page.
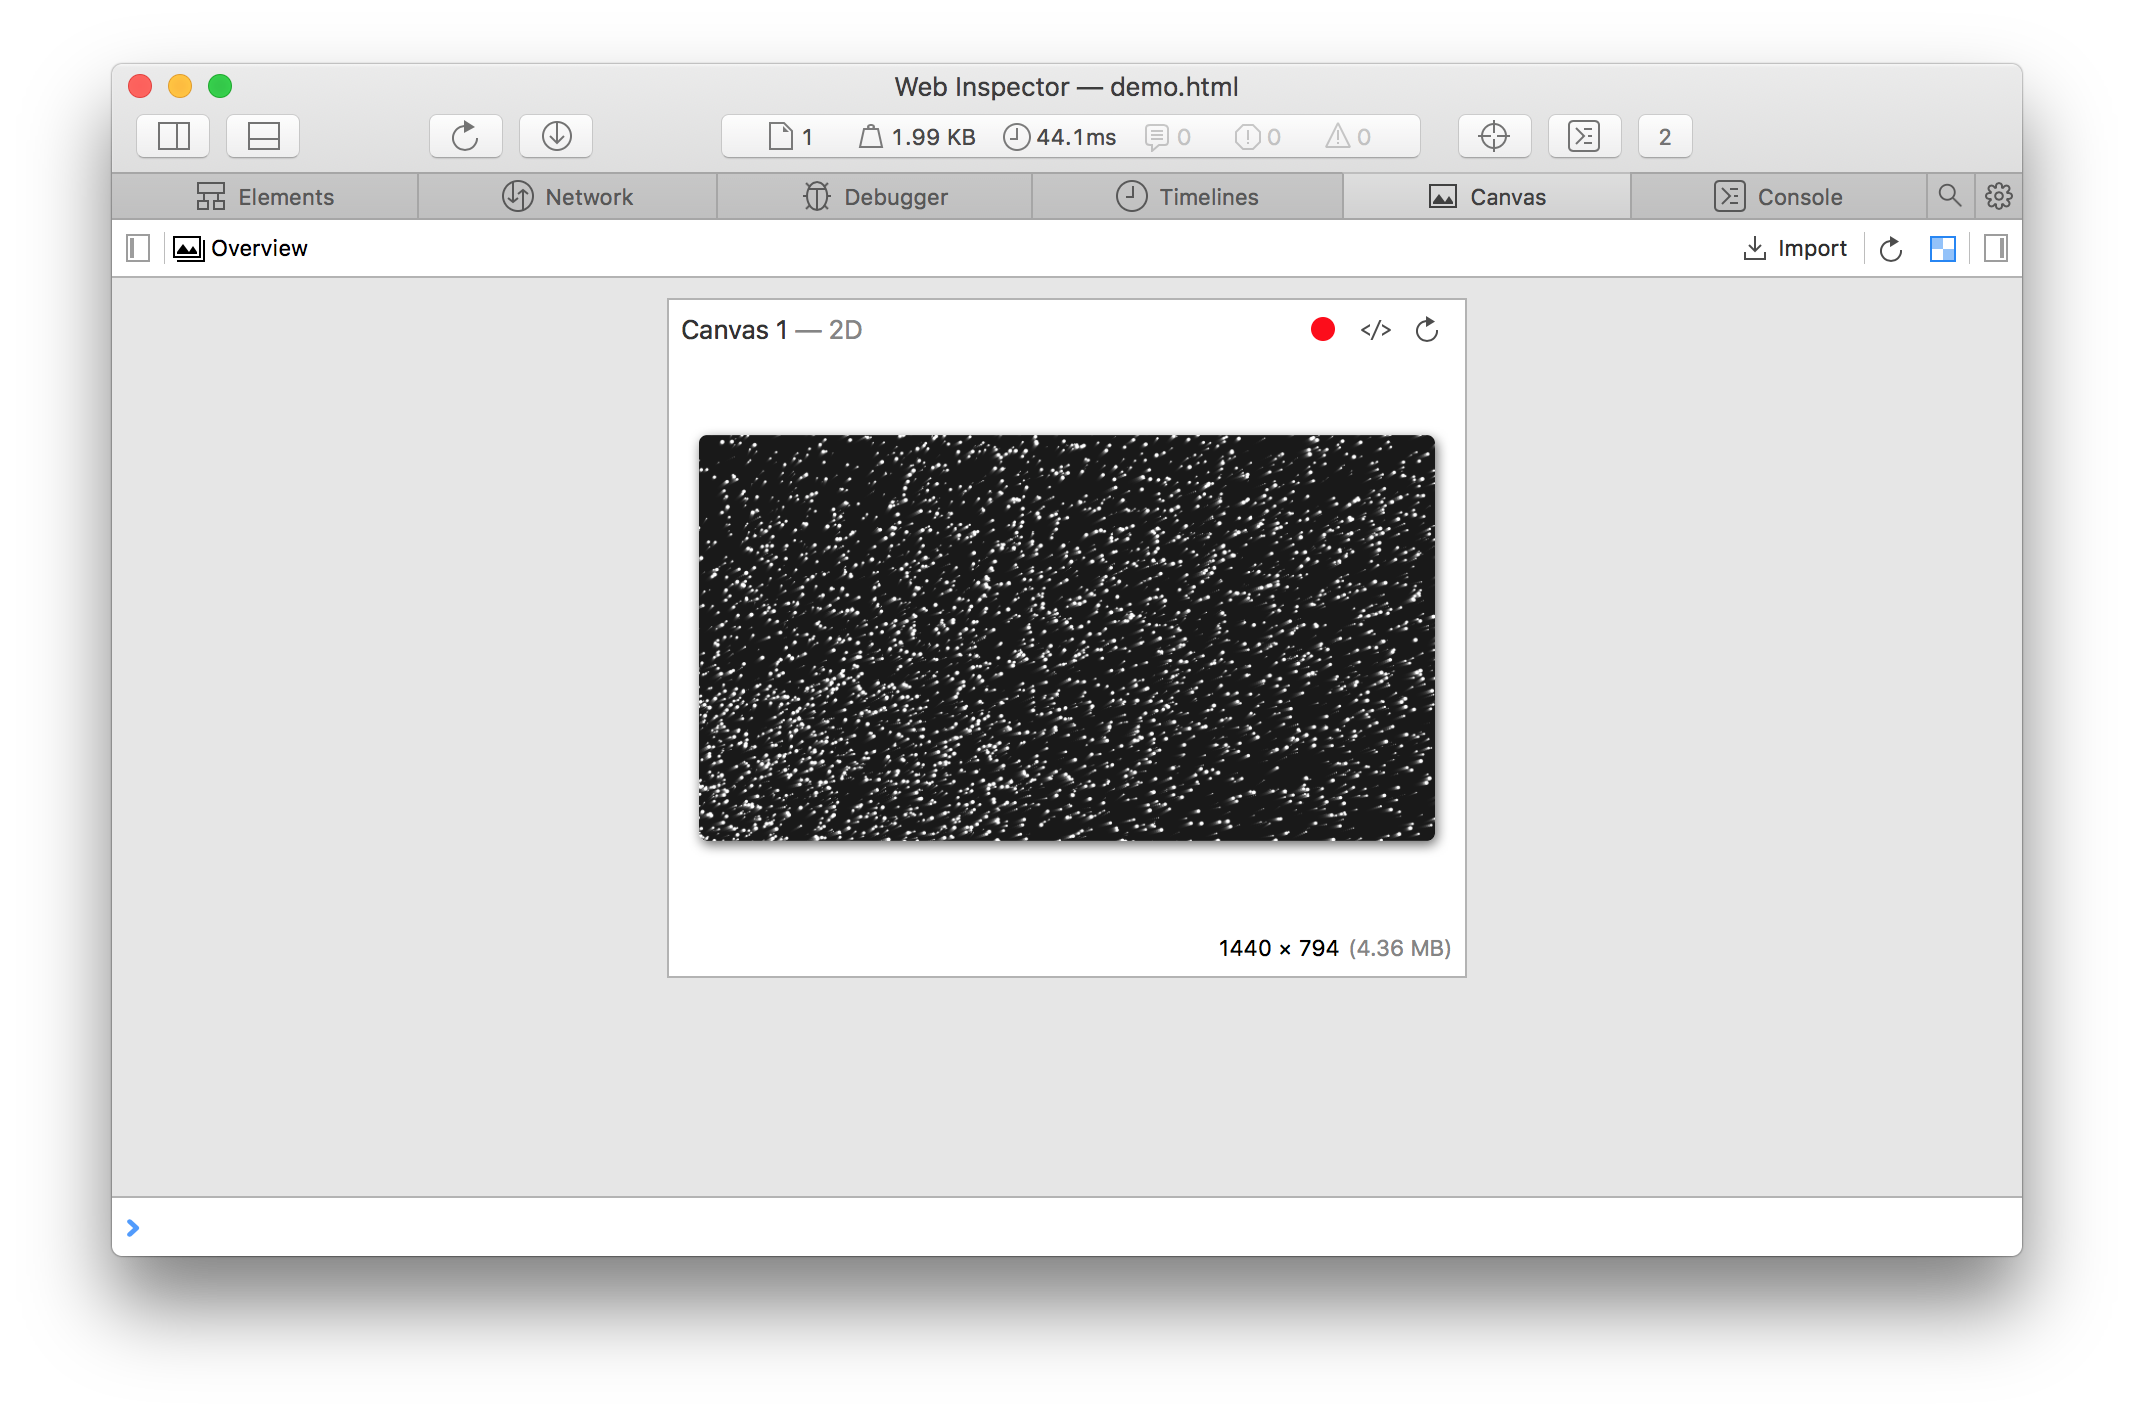
At any point, clicking on the refresh button in the top right of either the “card” or the Canvas tab will refresh the preview image(s) so that you can stay up to date on what you are looking at from the page.
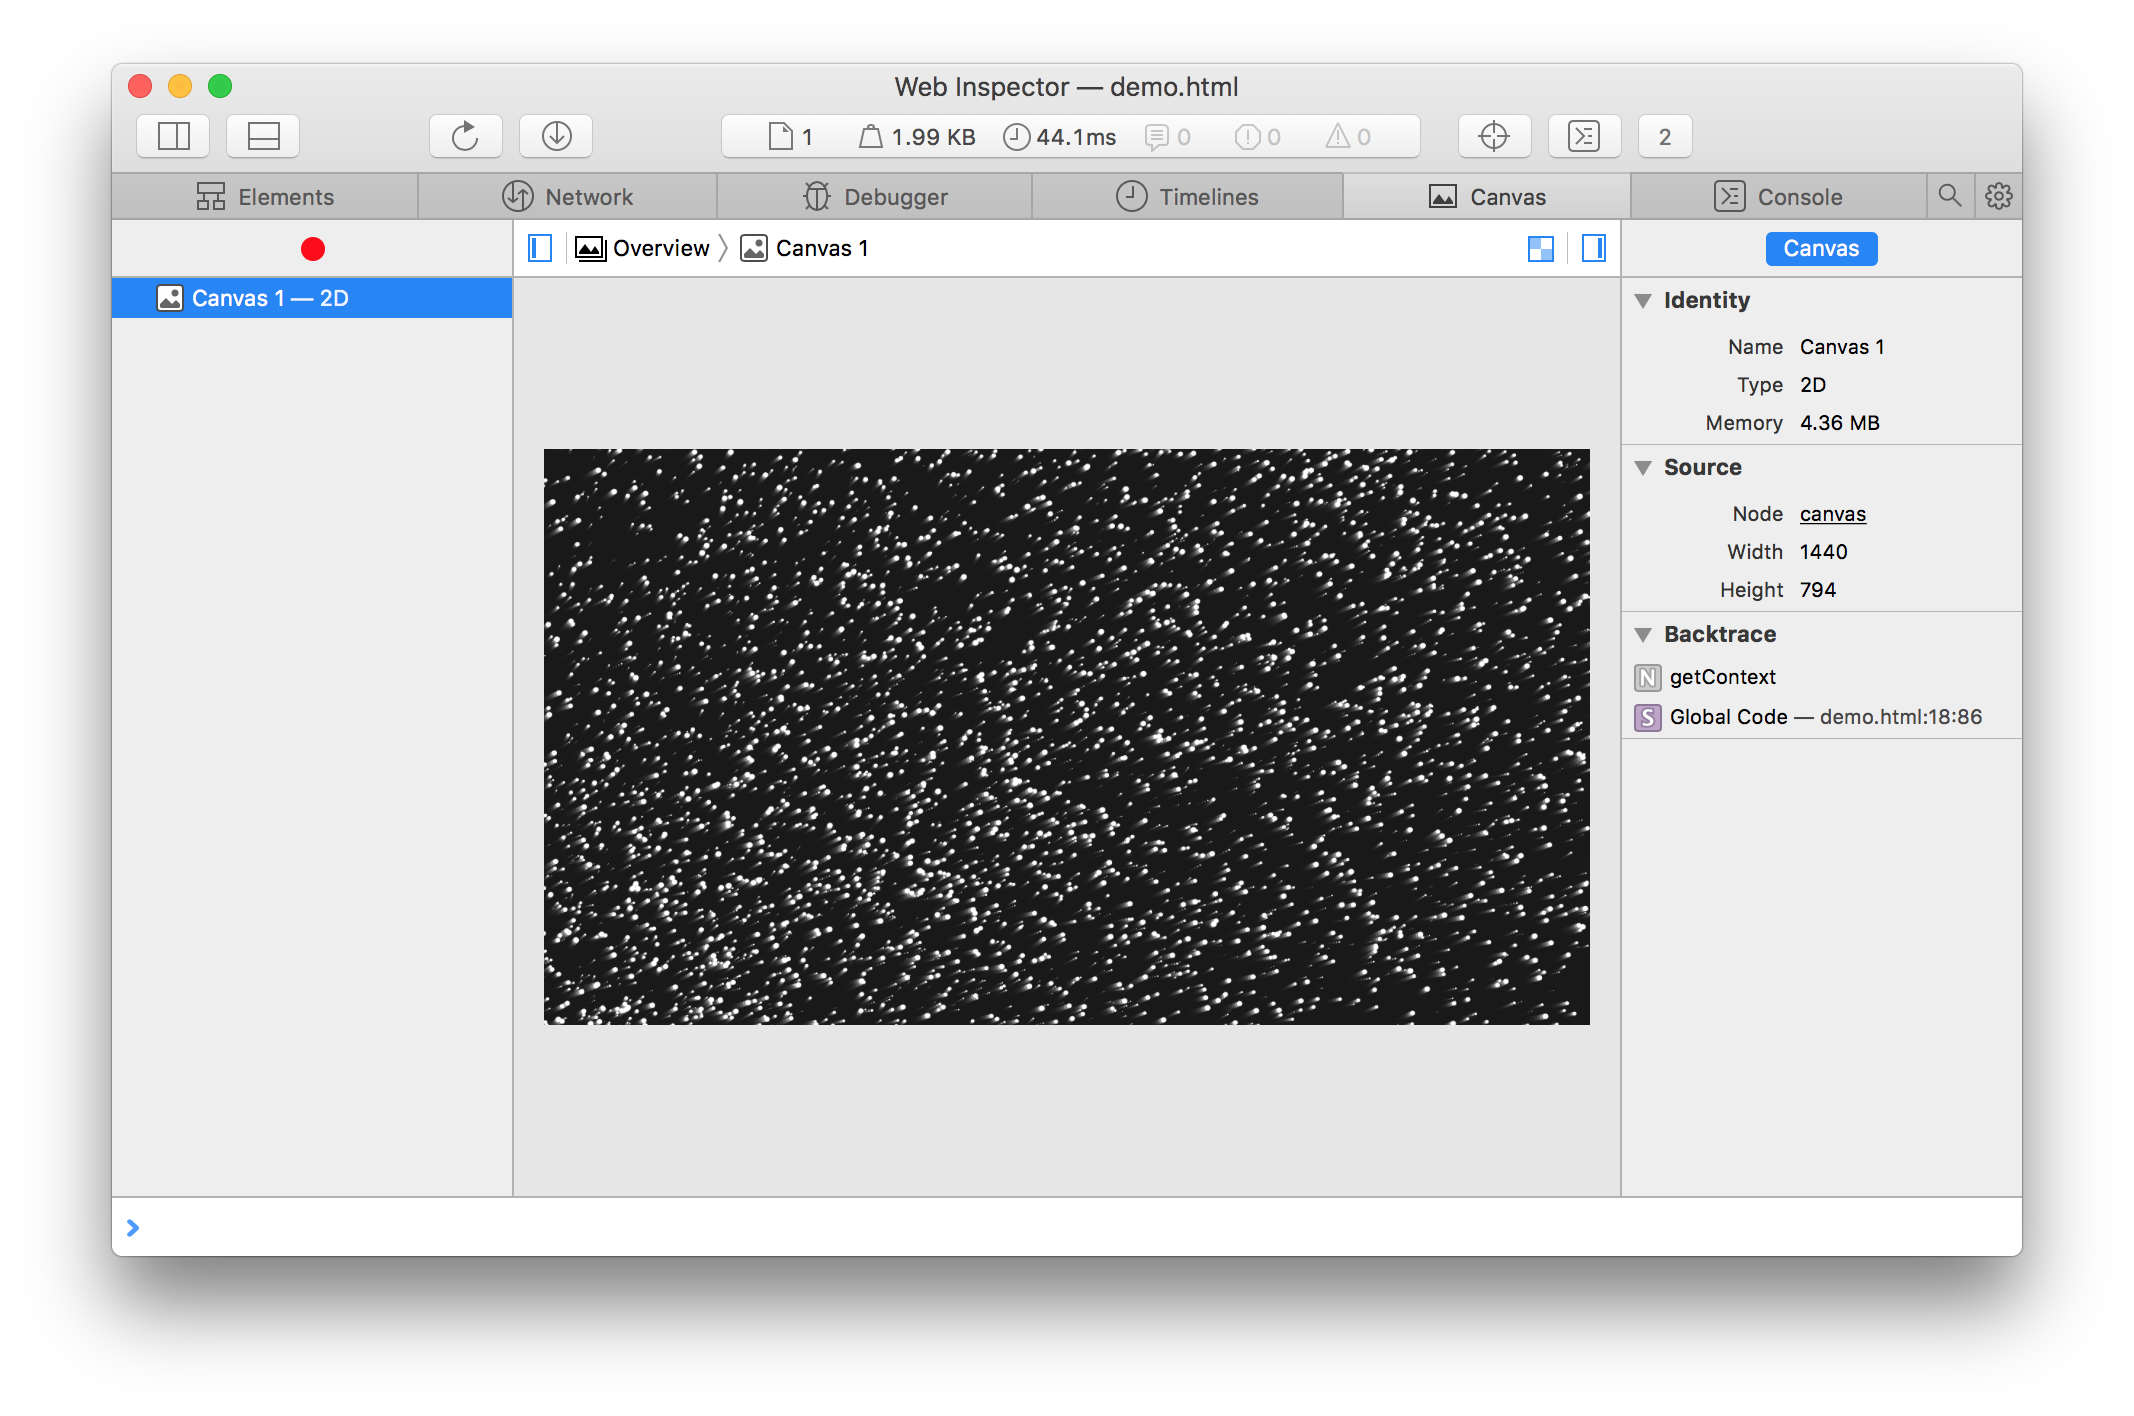
Clicking on any Canvas will “drill down” into a more specific view, where any attached objects, such as Shader Programs, can be viewed and edited.
Recording and Replaying Canvases
A big part of the Canvas debugging initiative was to provide a near-native exploration of exactly what happens to the Canvas. It’s often difficult to debug drawing code because so much of it occurs behind the scenes, as only a few actions actually cause changes (if any) to be drawn. 2D and WebGL canvases are now able to be recorded and visualized action-by-action as needed to debug any issues. Clicking the red circle next to the canvas preview (overview) or in the left sidebar (specific canvas) will start a recording. When you’ve reproduced the behavior you want to debug, click the button again to stop recording. It is also possible to take single-frame recordings by holding Shift when clicking. After some processing, the recording will become available for inspection.
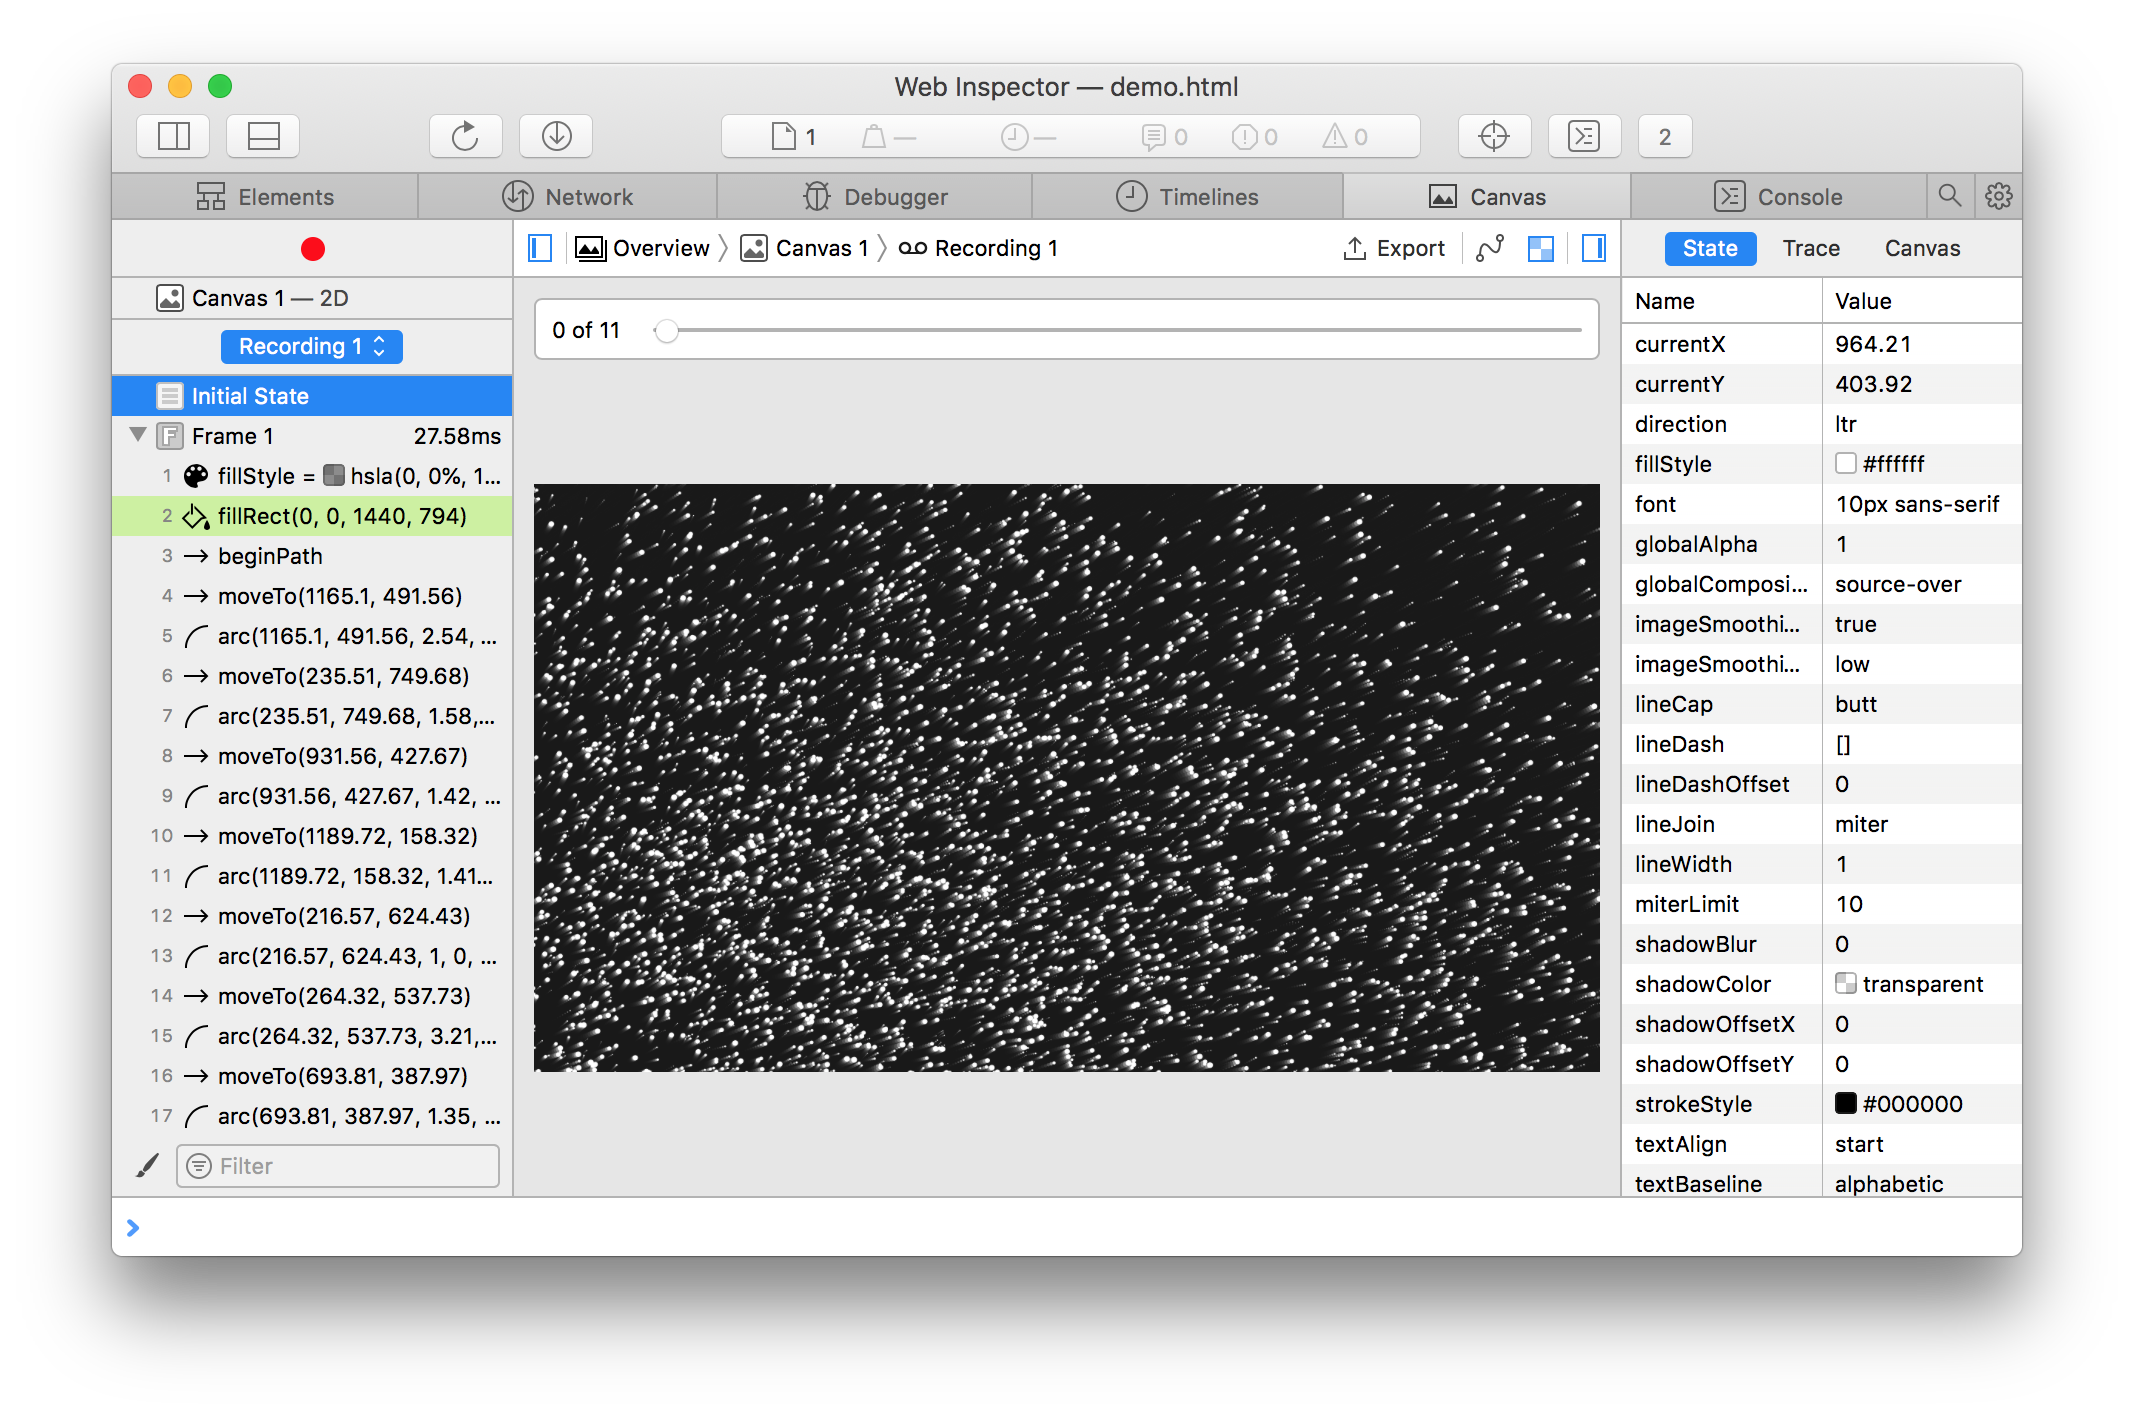
The recording view shows a list of all commands (left sidebar), the current state and backtrace (right sidebar), and the current output up to the selected command (center). Clicking on any action will apply it and everything prior to the preview, generating the same result as the one viewed in the actual page. Moving the slider will quickly jump between “visual” actions (highlighted in the left sidebar), which are those that can cause a visible change in the generated content.
Debugging 2D Paths
In the 2D Canvas world, there exists a concept called “path”. To give an analogy, imagine a painter using a pencil to sketch out a brush stroke before actually painting. For 2D Canvas, the “path” is this penciled line that can be used to draw more expressive shapes all in one go. Normally, like the pencil, this path is invisible until actually drawn/painted. This can lead to unintended results if the developer put the wrong value by accident.
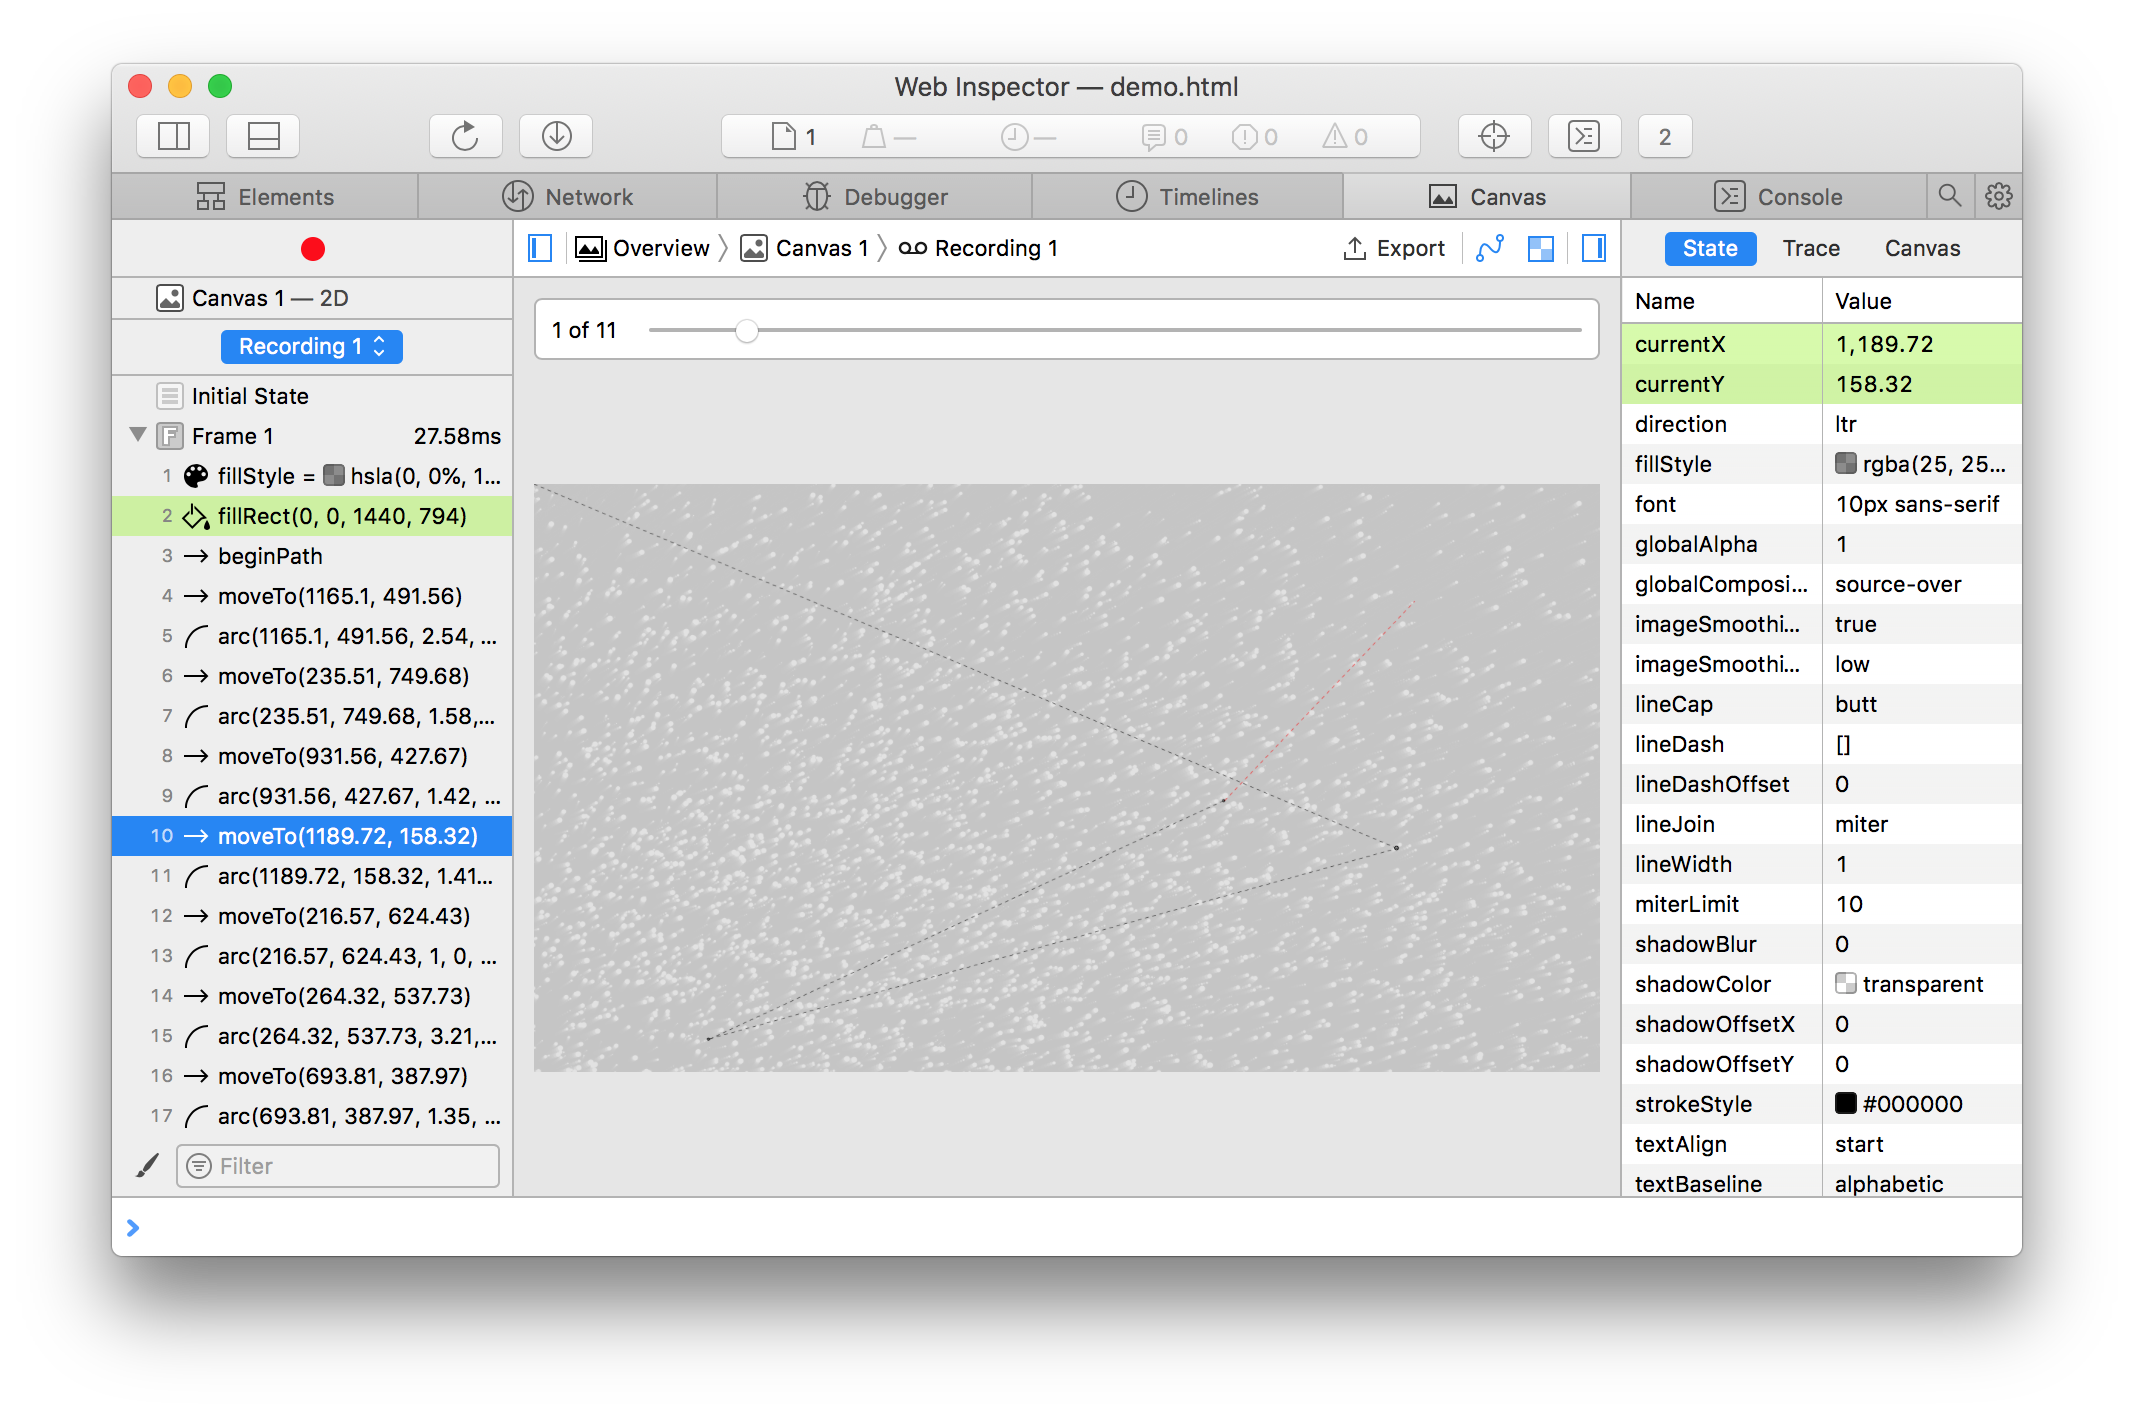
Dashed lines represent any “move” commands. The most recent path action is drawn in red.
Export and Import
One problem we envisioned while building Canvas Recording was that a recording is only as good as what it was able to capture. If a developer encounters a bug on their computer, but their coworker doesn’t have an issue, then there’s no real benefit to being able to record the buggy Canvas, especially if they don’t know how the code works. Our solution is to make Canvas Recording fully portable by allowing any recording to be exported to a JSON file and imported into any other computer.
All of the recording information is encoded into the JSON file, so loading it into any other computer will provide the exact same replay accuracy as on the origin computer. In order to minimize the size of a Canvas Recording, however, values are deduplicated and repeated keys are removed in favor of more compact arrays. According to our rough estimates, this decreased the average JSON size by about 30%.
Shader Program Editor
For more advanced Canvas usage, such as WebGL, it is often the case that much of the work is done in a Shader. In these cases, recording the Canvas might not be enough to determine the cause of a potential problem, as it might be due to an error in one of the Shaders used by the Canvas. In order to facilitate this, we have exposed all valid Shader Programs for the selected Canvas.
The original source of the Shader Program is shown in a split view for the Vertex and Fragment shaders. Each of these is editable, and will have an immediate effect on the inspected page.
In this way, bugs can be ironed out without having to edit the source of the page, or having to take additional recordings.
Playground
As a simple demo for debugging using Canvas Recording, this page is the one displayed in the screenshots above. It heavily utilizes canvas 2D paths, often times outside the bounds of the canvas. This is a good example of a time to optimize, as there’s no reason to draw something outside the visible space. Thanks to Canvas Recording, this issue is very apparent and has enough information to make a fix actionable.
Feedback
The Canvas tab is available in macOS High Sierra 10.13.4 and macOS Mojave. Is there a Canvas API that wasn’t covered here that you debug often? Let us know! Please feel free to send us feedback on Twitter (@dcrousso or @jonathandavis) or by filing a bug.