Web Inspector ReferenceDOM Breakpoints
DOM Breakpoints can be useful when debugging DOM modifications in JavaScript. They are set by right-clicking on any DOM node preview or link, such as the DOM Tree in the Elements Tab, and choosing one of the items in the Break on submenu.

Once a DOM Breakpoint has been added, it will be shown in both the DOM Tree in the Elements Tab and the Navigation Sidebar in the Sources Tab, and can be enabled/disabled/removed from both. Just like in the Sources Tab, clicking on


If a DOM Breakpoint has been added to a child DOM node, and one of the ancestor/parent DOM nodes is collapsed in the DOM Tree in the Elements Tab,


DOM Breakpoints are preserved between Web Inspector sessions, but they are only re-added if a DOM node that matches the tag path (i.e. tag name and index within the parent node all the way to the root) of that DOM Breakpoint exists in the current page (e.g. a DOM Breakpoint with the tag path body > div:nth-child(2) wouldn’t be shown if the second child of the <body> was not a <div>).
DOM Breakpoints have three different types: Subtree Modified, Attribute Modified, and Node Removed.
Subtree Modified
DOM Breakpoints of this type will pause JavaScript execution whenever any DOM node is added/removed to the subtree of the associated DOM node.
This is not limited to immediate descendants, however, so setting a Subtree Modified DOM Breakpoint on the <body> will pause JavaScript execution every time any DOM node is added/removed from any descendant of the <body>.
Attribute Modified
DOM Breakpoints of this type will pause JavaScript execution whenever any attribute is modified on the associated DOM node.
This includes when new attributes are added (e.g. setAttribute), and when existing attributes are completely removed (e.g. removeAttribute).
Node Removed
This DOM Breakpoint is very straightforward, in that it will pause JavaScript execution if the associated DOM node is removed from the DOM Tree.
This includes when an ancestor of the associated DOM node is removed from the DOM Tree as well.
Node Removed DOM Breakpoints entirely “consume” Subtree Modified DOM Breakpoints set on an ancestor DOM node, meaning that any Subtree Modified DOM Breakpoints set on any ancestor DOM nodes will not fire.
Configuration
DOM Breakpoints have a few different configuration options, reachable by right-clicking and selecting Edit Breakpoint… in the context menu.

The Condition input allows you to restrict the DOM Breakpoint to only pause JavaScript execution if the given JavaScript evaluates to a truthy value. This is useful for situations where you only want to pause JavaScript execution once a certain condition is met, such as a variable having a particular value. Keep in mind that the contained JavaScript is evaluated when the DOM Breakpoint is reached, and may cause additional side effects depending on the code you run as your condition.
Rather than execute arbitrary code, however, you may just want to ignore the first few times the DOM Breakpoint is reached. If this is the case, setting the Ignore input to any positive integer will prevent the DOM Breakpoint from pausing execution until it has been reached that many times.
Now you may be wondering what’s an Action. There are four different types:
-
Log Message
This is basically a “shortcut” for logging values using
console.log. The string you provide behaves like a template literal, meaning you can evaluate arbitrary JavaScript so long as it’s inside a${…}. -
Evaluate JavaScript
Arguably the most powerful DOM Breakpoint Action, it allows you to evaluate any arbitrary JavaScript whenever that DOM Breakpoint is hit. The given JavaScript is executed as if it were right before the line of code, meaning it will have access to all variables available in that scope before the related line.
-
Play Sound
Adding one of these will cause Web Inspector to play a system beep sound whenever the DOM Breakpoint is hit.
-
Probe Expression
Probe Expression s can be thought of almost like a mini-Console. Each time the related DOM Breakpoint is hit, the Probe Expression is evaluated and the result is saved in the Probe panel in the Details Sidebar in the Sources Tab, allowing you to see how the result of the expression changes during the lifetime of your program. You can use this to observe changes to a specific variable (e.g.
this), or to changes in an entire expression (e.g.this.foo === "bar").

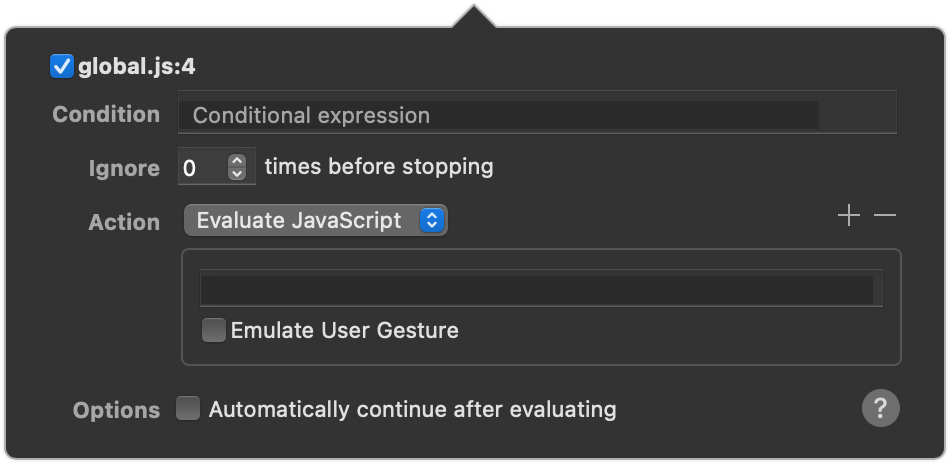


If any Action is set, you can also configure the DOM Breakpoint to Automatically continue after evaluating. This will cause the DOM Breakpoint to become effectively “invisible”, in that it will never pause execution. DOM Breakpoints that Automatically continue after evaluating will have a small white triangle (“hollow”) in the icon:


State
DOM Breakpoints can either be enabled


- the DOM Breakpoint was manually disabled
- breakpoints have been globally disabled

All enable/disable/delete toggles are available in the context menu when right-clicking on any DOM Breakpoint.
Icon legend:


 Updated for Safari Technology Preview 120. Try it out for the latest Web Inspector features, including all of the above and more.
Written January 14, 2020 by Devin Rousso
Last updated July 13, 2021 by Devin Rousso