Web Inspector ReferenceWeb Inspector Settings
Developers often have varying preferences or workflows that can significantly affect their productivity.
Web Inspector has a variety of settings that control different aspects of the interface and workflow, all of which are preserved across Web Inspector sessions.
These settings can be changed via the Settings Tab:

The Settings Tab itself is further divided into a number of panes, each of which contains inputs for a “category” of settings.
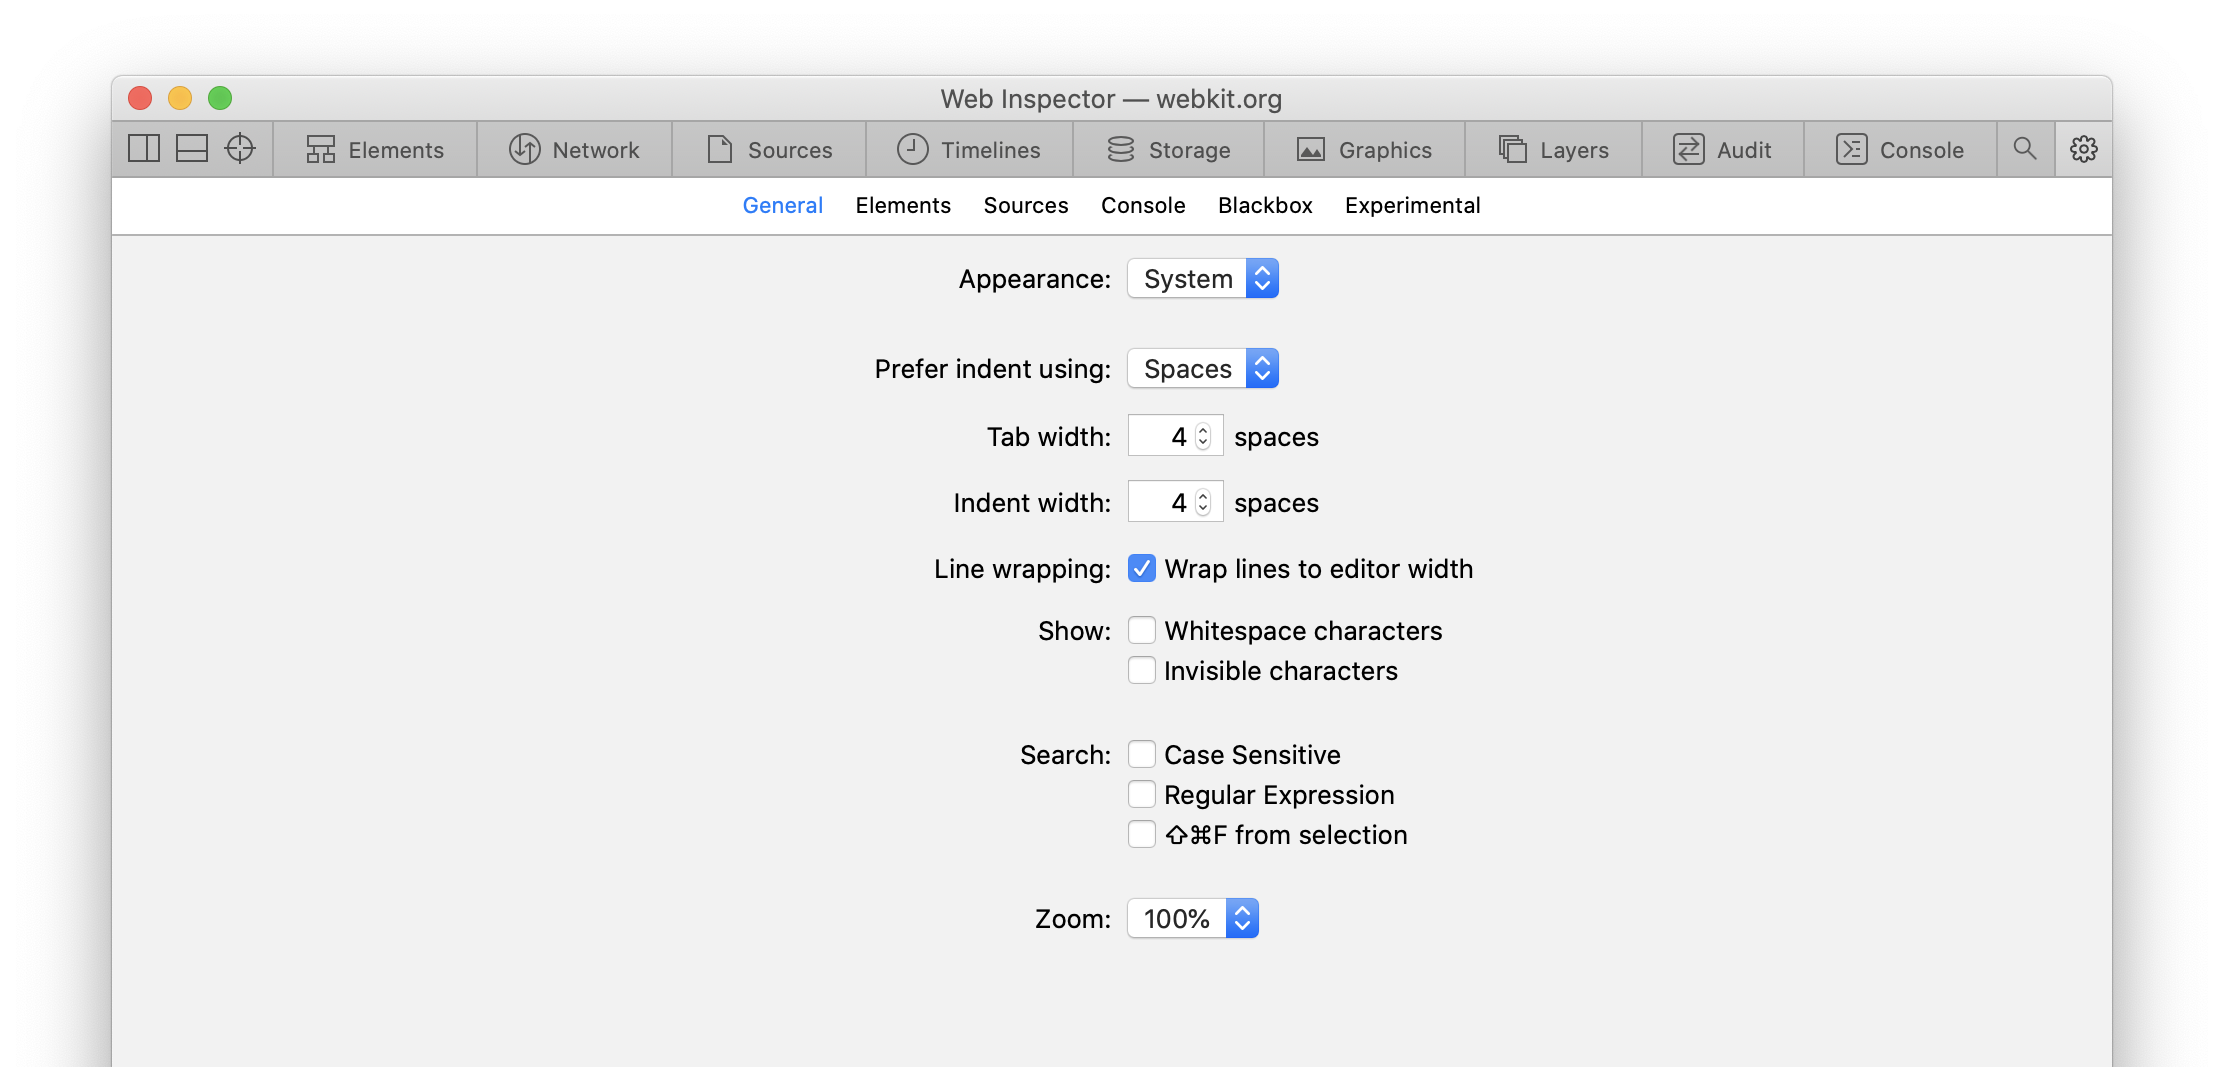
General
This pane contains settings that are used thoughout the interface.

- Appearance controls the appearance of the Web Inspector interface.
- Prefer indent using controls what character text areas use for indentation (spaces vs. tabs).
- Tab width controls the width of a tab, measured in the number of spaces it would take to render with the same size in a monospaced font. This has the same effect as the
tab-sizeCSS property. - Indent width determines the width of each level of indentation in the number of spaces it would take to render with the same size in a monospaced font.
- Line wrapping contains settings related to line wrapping in text areas.
- Wrap lines to editor width controls whether lines that are longer than the text area’s width should overflow horizontally “off screen” (thereby allowing for horizontal scrolling) or whether they should automatically wrap to prevent that.
- Show contains settings related to how certain content is shown in text areas.
- Whitespace characters controls whether whitespace characters are shown (
·for each space and—for each tab) in text areas. - Invisible characters controls whether non-printable characters (e.g. carriage return, which is
\rand/or↵) are shown in text areas. - Search contains settings related to the various ways which content is searched/filtered in Web Inspector.
- Case Sensitive controls whether the given search string should be case sensitive.
- Regular Expression controls whether the given search string should be interpreted as a regular expression.
- ⇧⌘F from selection controls whether the global search should be populated by the currently selected text when invoked via
⇧⌘F. - Zoom controls the magnification of Web Inspector’s interface.
Elements
This pane contains settings specific to DOM debugging and the Elements Tab.

- DOM Tree contains settings related to DOM tree.
- De-emphasize nodes that are not rendered controls whether DOM nodes that are not actually rendered in the inspected page are be displayed in greyscale.
- Element Selection contains settings related to element selection using the Page Overlay.
- Show page rulers and node border lines controls whether page rulers and node border lines are shown during element selection.
- Details Sidebars contains settings related to the Details Sidebar.
- Show independent Styles sidebar controls whether the Styles panel is shown as a separate column.
- CSS contains settings related to CSS introspection and debugging tools.
- Show changes only for selected node controls whether the Changes panel in the Details Sidebar shows modifications made using Web Inspector to any CSS rule or only to those that match the currently selected DOM node in the DOM Tree.
- Show property syntax in documentation popover controls whether syntax is shown when viewing documentation about a CSS property.
Sources
This pane contains settings related to how Web Inspector treats resources, as well as settings that affect the workflow of debugging resources.

- Debugging contains settings related to the debugging experience with resources (e.g. JavaScript and CSS).
- Show Scope Chain on pause controls whether the Scope Chain panel in the Details Sidebar in the Sources Tab is automatically shown shown whenever JavaScript execution pauses.
- Source Maps contains settings related to source maps.
- Enable Source Maps controls whether Web Inspector automatically fetches source maps for resources it knows about.
- Images contains settings related to how images are shown in Web Inspector.
- Show Transparency Grid controls whether Web Inspector draws a checkerboard background behind images to help visualize transparent content.
Console
This pane contains settings related to the Console, as well as controls for whether certain types of information are logged to the Console from the inspected target.

- Saved Result Alias allows you to set an alternate prefix for saved values in the Console.
- Traces contains settings related to
console.trace. - Auto-expand determines whether
console.tracemessages should automatically be expanded when they’re first shown in the Console. - WebRTC Logging controls the amount of information that WebKit logs to the Console related to WebRTC.
- Media Logging controls the amount of information that WebKit logs to the Console related to media content, such as
<video>. - MSE Logging controls the amount of information that WebKit logs to the Console related to Media Source Extensions.
Blackbox
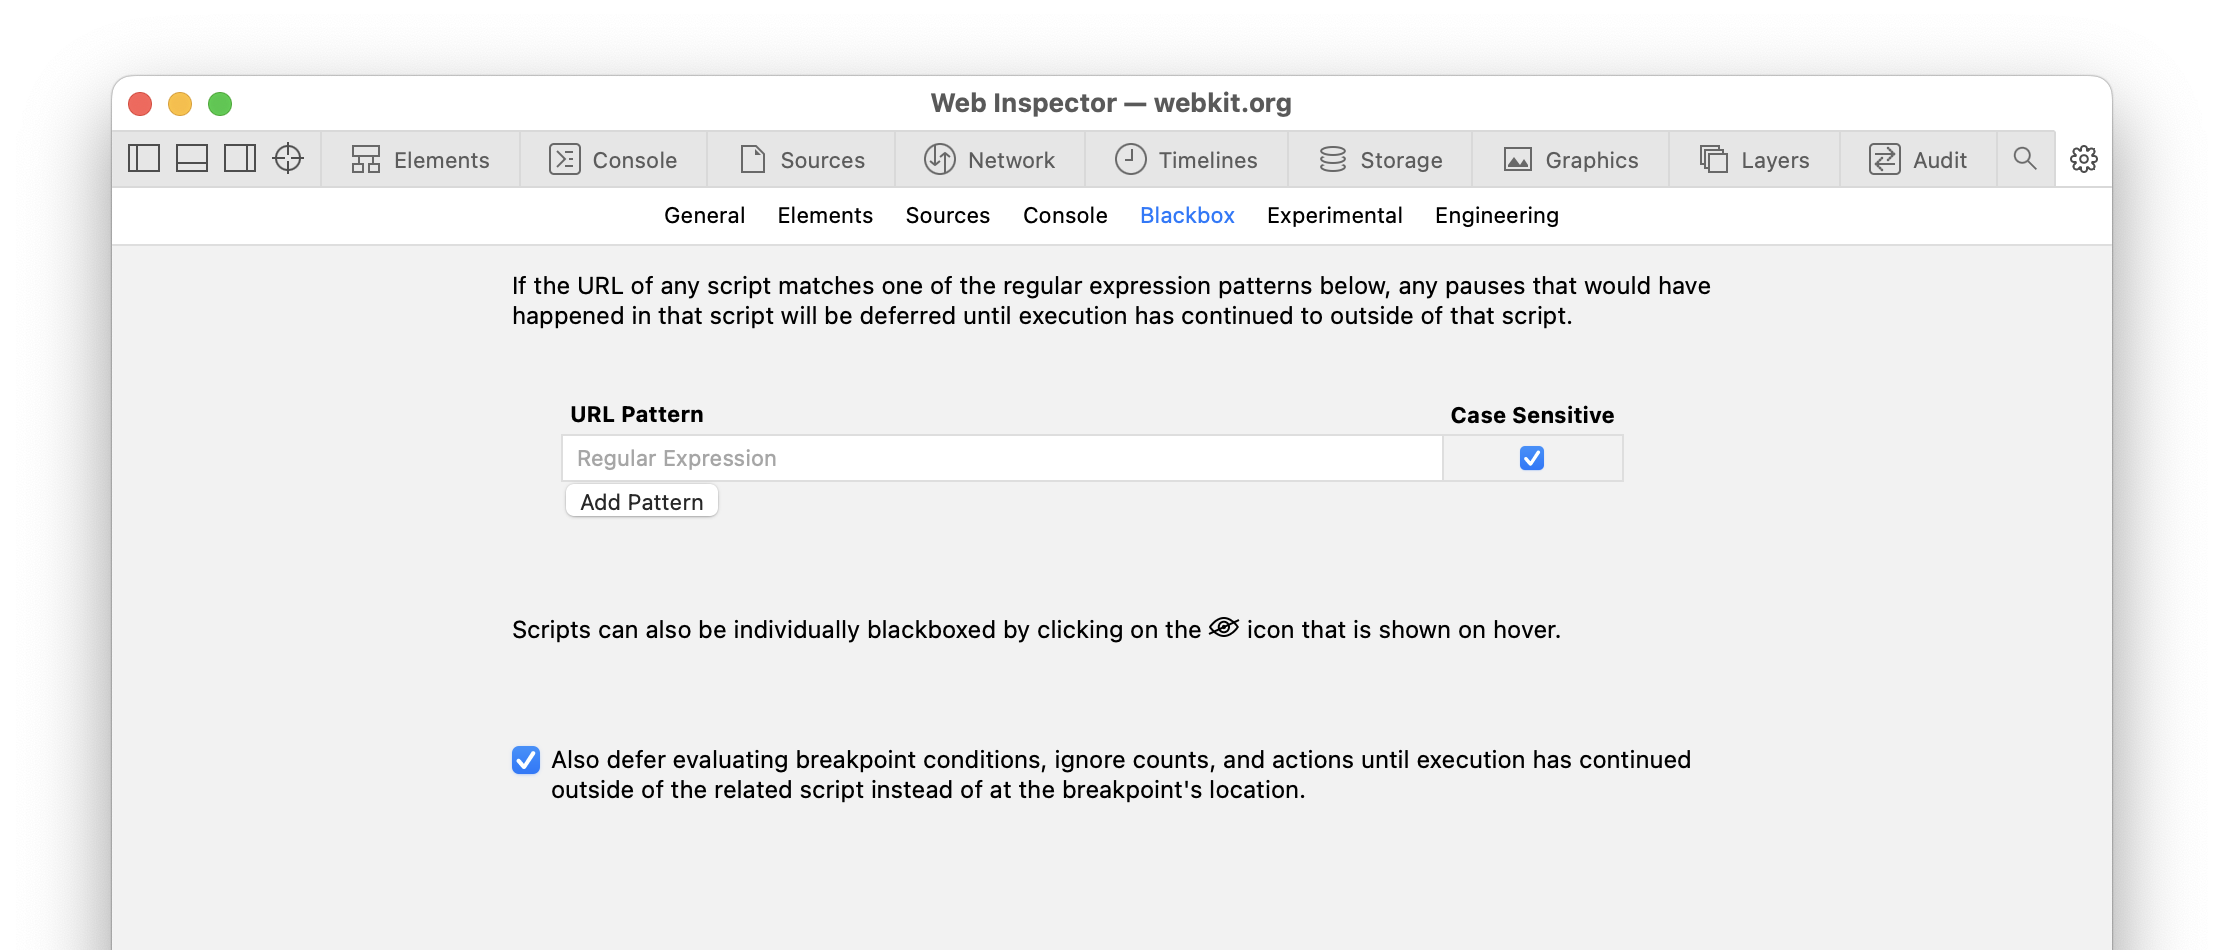
This pane contains settings related to script blackboxing, which is the ability to indicate to the JavaScript debugger that it should never pause JavaScript execution inside any given script.

For more information, please read Script Blackboxing.
Experimental
This pane contains settings that control in-development features, often including things like:
- general changes to the overall interface
- entirely new features or workflows, often in their own tab or sidebar panel
- redesigned systems or debugging tools, added alongside or as an enhancement to existing ones
Keep in mind that these features are experimental, and can change even between subsequent versions of Safari Technology Preview.
 Updated for