Web Inspector ReferenceWeb Inspector Interface
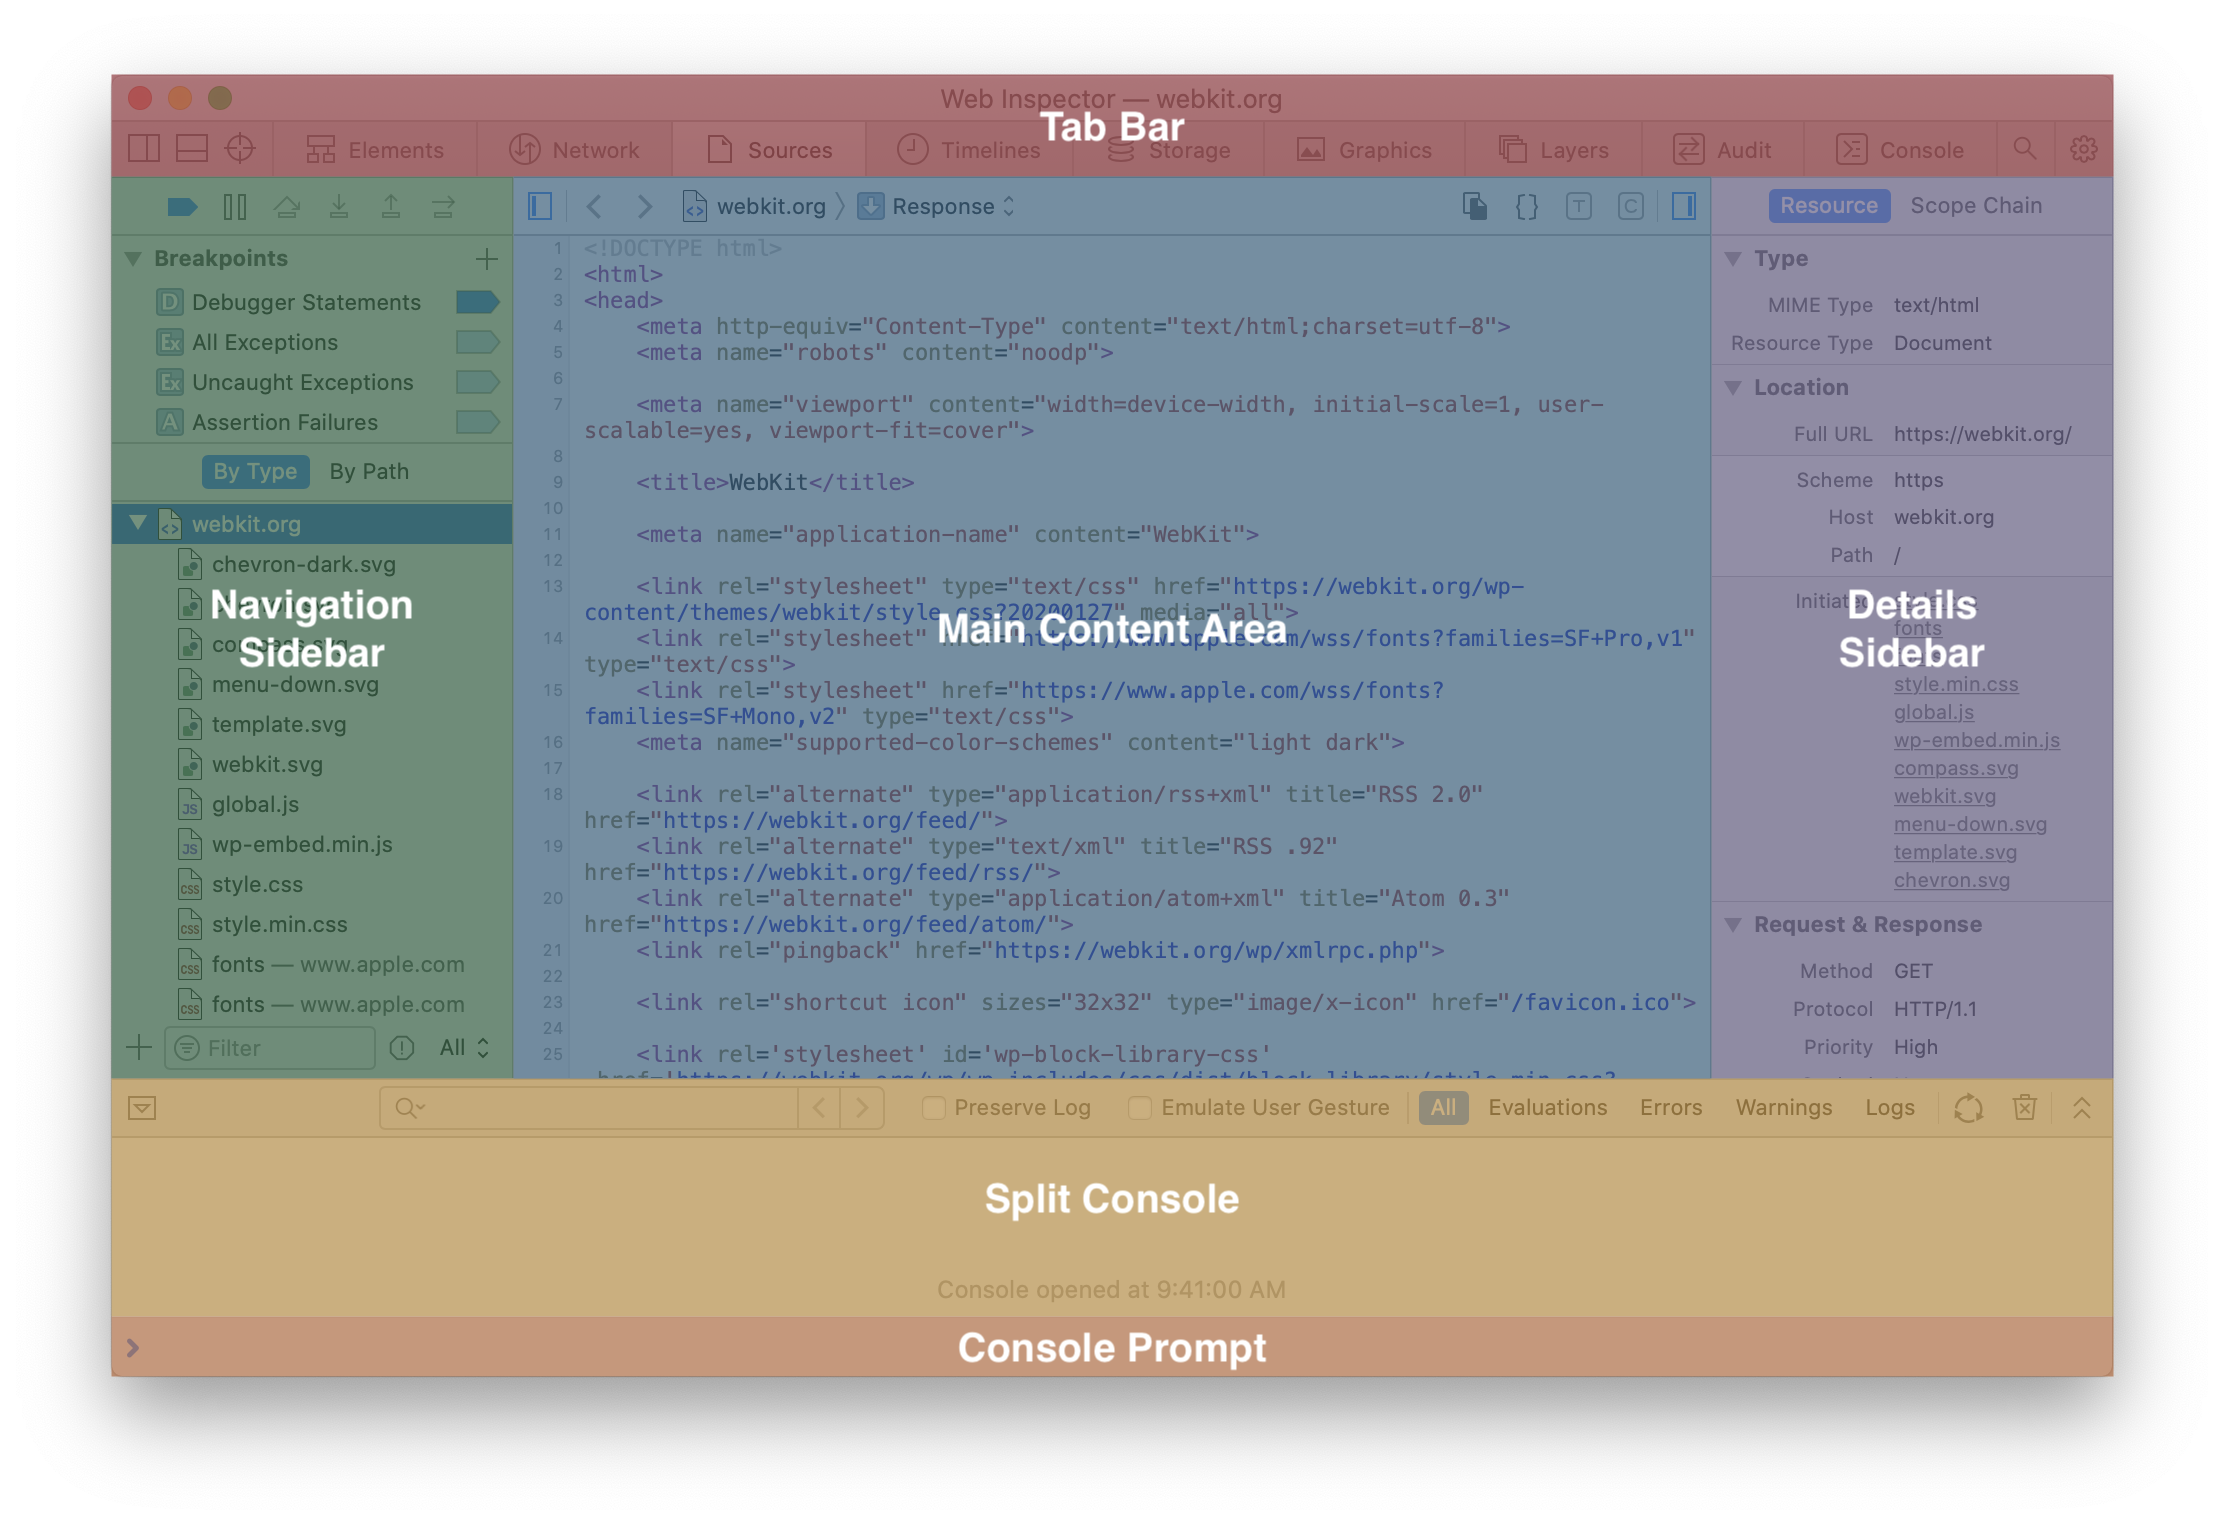
Web Inspector is divided into six main areas.

Tab Bar
The Tab Bar has a list of tabs, each with a specific utility.
Tabs can be reordered by dragging, and can also be added/removed by right-clicking on the Tab Bar and checking/unchecking the item for the desired tab.
The Tab Bar also contains:
- docking configuration buttons:
- controls for other functionality in the inspected page:
⇧⌘C.⌘R. Only shown for remote inspection.WebArchive. Can also be done by pressing⌘Sin the Elements Tab. Only shown for remote inspection.
- Console indicators:
- pinned tabs:
⇧⌘F.⌘,.
If Web Inspector is too narrow, tabs are condensed into a
Navigation Sidebar
The Navigation Sidebar contains a list of items related to the selected tab. Selecting one of those items will update the Main Content Area and any related panels in the Details Sidebar
There is a filter bar at the bottom of every Navigation Sidebar that respects the global search settings to filter the list of items to make finding the right item easier.
Some tabs don’t have a Navigation Sidebar, in which case the Main Content Area is responsible for selecting and showing information about any of the tab’s known items. For tabs that do have a Navigation Sidebar, it can be expanded/collapsed by clicking on ⇧ ⌘ 0.
Main Content Area
The Main Content Area shows a representation of the selected item in the Navigation Sidebar.
If the selected tab does not have a Navigation Sidebar, the Main Content Area will show the items related to the selected tab instead.
The top of the Main Content Area can contain:
- Selection breadcrumbs that show the path of the selected item in the Navigation Sidebar. Clicking any item will show a context menu with items for each sibling of that item, allowing for quick hierarchical selection switching, or alternate representations of the currently shown content, such as switching between a resource’s request and response.
- One or more content-specific controls, each with unique functionality, such as:
⌘S.⌘K.
Details Sidebar
The Details Sidebar contains one or more panels which can be conditionally shown based on the selected item in the Navigation Sidebar or Main Content Area, each providing various types of additional information.
Some tabs don’t have a Details Sidebar, showing all information in the Main Content Area instead. For tabs that do have a Details Sidebar, it can be expanded/collapsed by clicking on ⌥ ⌘ 0.
Split Console
The Split Console is a collapsable scrolling list of all logging activity, which shares content and state with the Console Tab.
Some tabs don’t allow the Split Console to be expanded as it wouldn’t fit with the layout of the rest of the tab. For tabs that do allow the Split Console, it can be expanded/collapsed by pressing esc or collapsed by clicking on
It is also possible to open the Console Tab from the Split Console by clicking on
Console Prompt
The Console Prompt is an input field that allows you to evaluate arbitrary JavaScript in any execution context of the inspected page. These evaluations and their results will appear in both the Split Console and the Console Tab.
Execution contexts include <iframe>, Worker, and even isolated worlds created by browser extensions or other APIs. If there is more than one execution context in the inspected page, an execution context picker is shown at the right of the Console Prompt.
The Console Prompt can be focused by pressing esc or ⌃ `.
It may now be apparent from the above that Web Inspector has a ton of functionality across a wide swath of topics. But sadly there’s only so much space for links and buttons and all the other interface elements once the actual content of the page is taken into account. As such, Web Inspector leverages tooltips and context menus to add longer descriptions and/or provide additional functionality that’s perhaps not as frequently useful. Every icon throughout Web Inspector has a tooltip that explains the action of that icon (which is highlighted in these reference pages via [Tooltip Text]). Pictures of especially useful context menus are also included where pertinent, such as in the Elements Tab. It’s likely that Web Inspector is already able to do the thing you want, so when in doubt, try hovering to view the tooltip or right-clicking to show the context menu and see it there.


 Updated for