Speedometer 3.0:
The Best Way Yet to Measure Browser Performance
As announced on browserbench.org today, in collaboration with other browser engine developers, Apple’s WebKit team is excited to introduce Speedometer 3.0, a major update that better reflects the Web of today. It’s built together by the developers of all major browser engines: Blink, Gecko, and WebKit with hundreds of contributions from companies like Apple, Google, Intel, Microsoft, and Mozilla. This post is a deep dive into how the collaborative Speedometer project improved the benchmark’s measurements methods and test content.
To recap history, in 2014, the WebKit team at Apple released the Speedometer browser benchmark, designed to measure the responsiveness of websites and web apps.
The original Speedometer simulated user interactions in web applications, driving TodoMVC sample apps written using different JavaScript frameworks to add, complete, and remove todo items. It was unlike other DOM or web app benchmarks publicly available at the time. These older benchmarks were mostly collections of micro-benchmarks, and didn’t reflect how DOM APIs were used in real web apps, or how individual APIs interacted with the rest of the web browser engine. Speedometer quickly became an important tool for performance measurement and tuning not just in WebKit but also in other browser engines.
In 2018 the WebKit team, in collaboration with Google’s Chrome team, released Speedometer 2.0, updated to use the latest frameworks and libraries available at the time. The Speedometer benchmark has since gained even more popularity among browser engines as a guide for optimization, and among independent testers and reviewers to compare different devices, operating systems, and browsers.
Today’s release of Speedometer 3.0 marks a major step forward in web browser performance testing. It improves the accuracy of measurement and measures the performance of a wide variety of contents.
Cross-Browser Collaboration
Speedometer 3.0’s release is a result of the collaboration among browser developers to improve the Web as a whole together. Much as Interop 2024 represents joint work to test and improve standards compliance, Speedometer 3.0 is a joint effort to test and improve browser performance.
Where previous Speedometer versions were developed as part of the WebKit project, Speedometer 3.0 has been developed and released under a joint multi-stakeholder governance model including the three major engine browsers: Blink, Gecko, and WebKit, and the repository has received hundreds of open source contributions since the original announcement in December 2022. This collaboration better ensures fairness in measurement and workload composition. And together, the group created a shared vision for the benchmark.
Improved Test Harness
We’ve improved the way Speedometer measures runtime performance. Prior Speedometer versions measured the time to run a test script synchronously as “sync” time; and the time until a zero-delay timer scheduled at the end of “sync” work fires as “async” time, as shown in the following diagram:
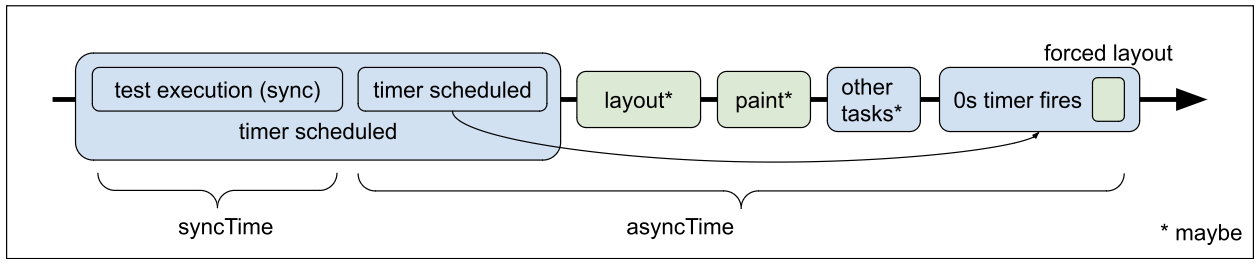
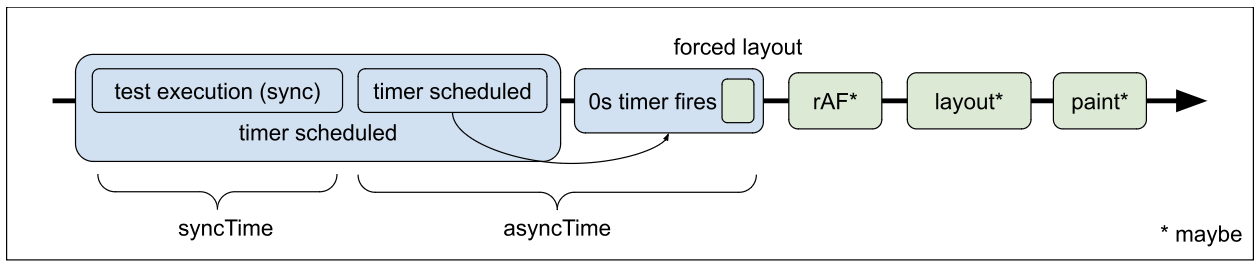
However, this method sometimes misses important work that browser engines do in response to script-driven changes, because synchronous tasks and the zero-delay timer are scheduled without considering the timing of rendering updates. It also didn’t capture any work frameworks delay until the next requestAnimationFrame (rAF) callback, a common technique in modern frameworks. The following diagram illustrates how important work could be missed by the time calculations.
Speedometer 3.0 takes advantage of the fact that all browser engines have adopted the HTML5 event loop model for updating the webpage rendering. It measures test scripts within a requestAnimationFrame callback as “sync” time, and the time to fire zero-delay timer scheduled in a second requestAnimationFrame as “async” time:
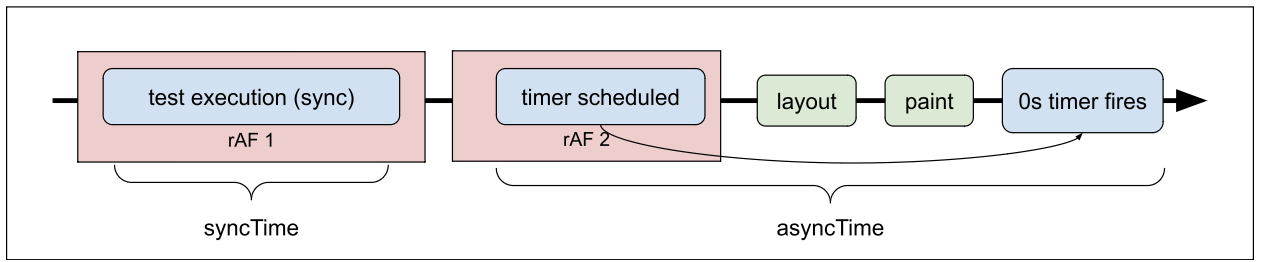
Because the zero-delay timer is now scheduled in a second requestAnimationFrame, it’s guaranteed to be fired after all the zero-delay timers scheduled during the synchronous portion of the test had fired. Thanks to HTML5’s event loop processing model, browser engines update the rendering of web pages after all requestAnimationFrame are called before the next zero-delay timer fires. These changes greatly improved Speedometer’s ability to accurately measure the runtime of synchronous work and asynchronous work browsers do in response to script that handles user events.
The test harness has also been rewritten to use modern JavaScript features like modules, native promises, let & const, async & await, and class syntax, which were not widely available at the time Speedometer 1.0 was first written.
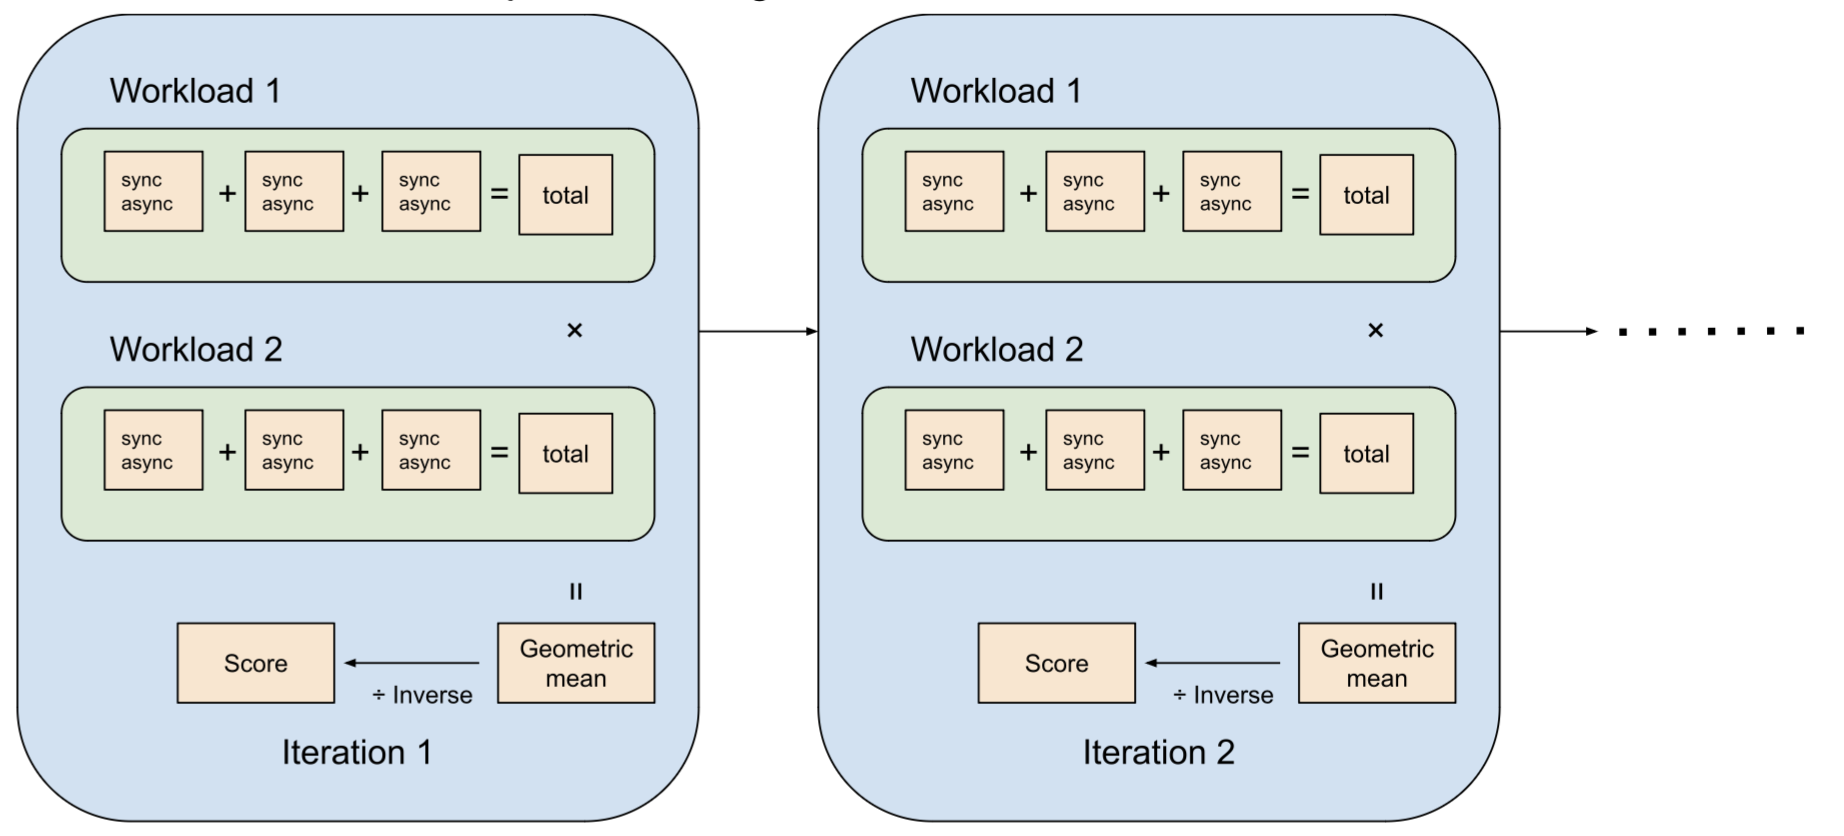
Like its precursors, Speedometer 3.0 sums up the runtime taken to simulate user actions such as adding todo items, completing them, and removing them per each workload, and computes the geometric mean of the totals across different workloads. The final score is calculated as the arithmetic mean of the reciprocal of the geometric mean:
Adjustment to Score
Since Speedometer’s benchmark content was last updated in 2018, web browsers have gotten increasingly better at handling Speedometer content. Moreover, new hardware, such as Apple Silicon Macs, continues to push the boundary of what’s possible in computing. Where originally scores were scaled to be under 100, modern browsers now can score over 500 on the fastest devices. To make scores easier to compare and to make room for future improvements, we’ve adjusted the score so that a typical web browser will get a score in the 20-30 range to start out.
Updated UI Frameworks
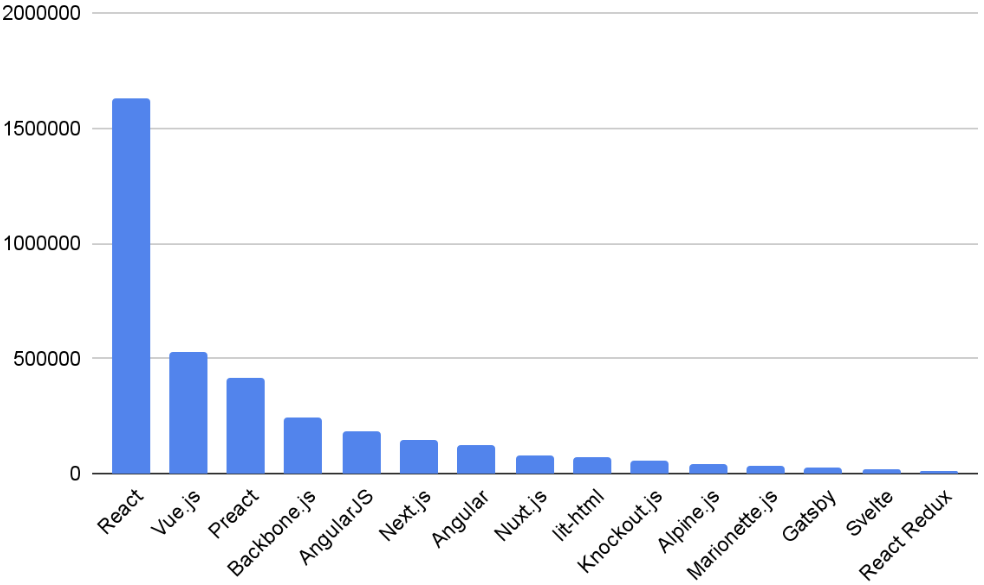
Now let’s take a look at the test content in Speedometer 3. Like the past versions of Speedometer, version 3.0 includes TodoMVC-based todo apps that emulate adding, completing, and removing todo items. To better represent the modern Web, the most widely used JavaScript UI frameworks were identified from the HTTP Archive in March 2023:
The monthly downloads in NPM was also taken into account to find frameworks with high momentum:
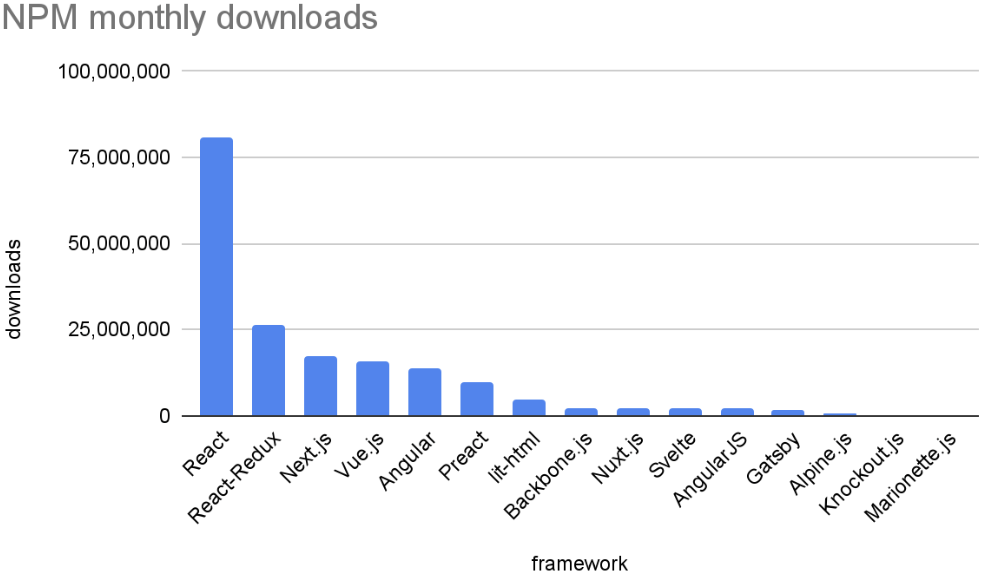
Based on these data points, we’ve included the following JavaScript frameworks in our todo apps: Angular, Backbone, jQuery, Lit, Preact, React, React+Redux, Svelte, and Vue. For each framework, the most commonly used version at the time was picked. Todo implementations written in vanilla JavaScript using ES5, ES6, and web components are also included.
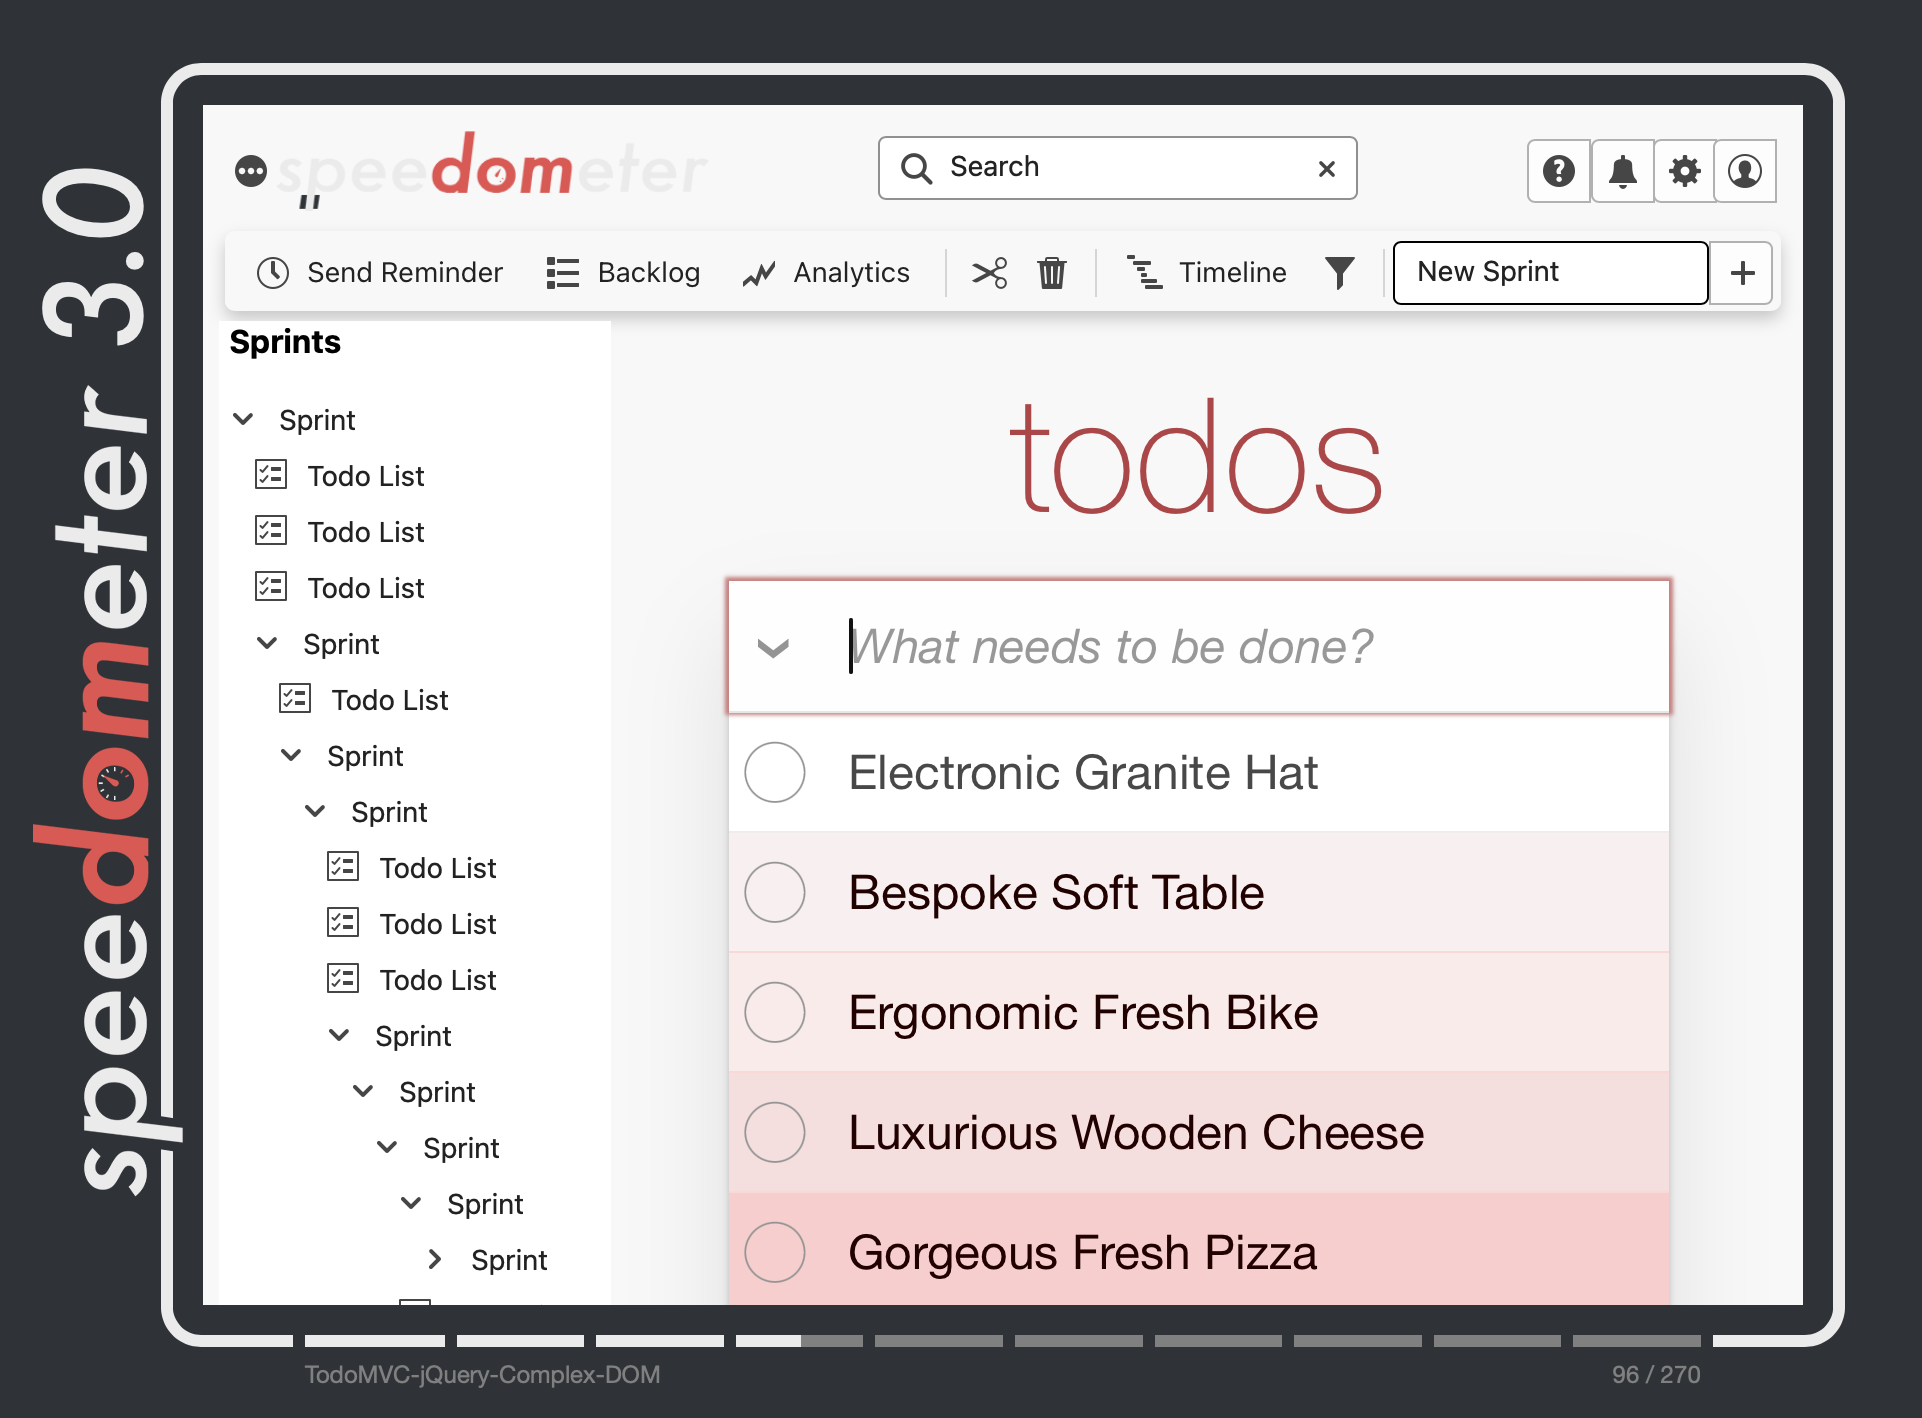
Complex DOM Versions
In addition, Speedometer 3.0 includes “complex DOM” versions of some of the TodoMVC applications. In these complex DOM versions, each todo app is embedded inside a UI structure which mimics a web application with many deeply nested DOM nodes and plenty of CSS rules. Even though the benchmark still emulates the same set of operations, doing so in the context of more DOM elements and CSS rules adds work and captures additional performance bottlenecks.
In order to ensure the variety of performance scenarios to be tested, Speedometer 3.0 includes 6 simple DOM todo applications and 6 complex DOM todo applications.
Broader Content
Together, these changes to todo apps dramatically improved the coverage of the benchmark. But Speedometer 3.0 takes it a step further and includes entirely new kinds of applications.
Speedometer 3.0 includes two test apps that mimic typical news sites, built using the popular single page application frameworks Next.js and Nuxt. It emulates user actions such as clicking on menu items and navigating to another page in the single page app setup.

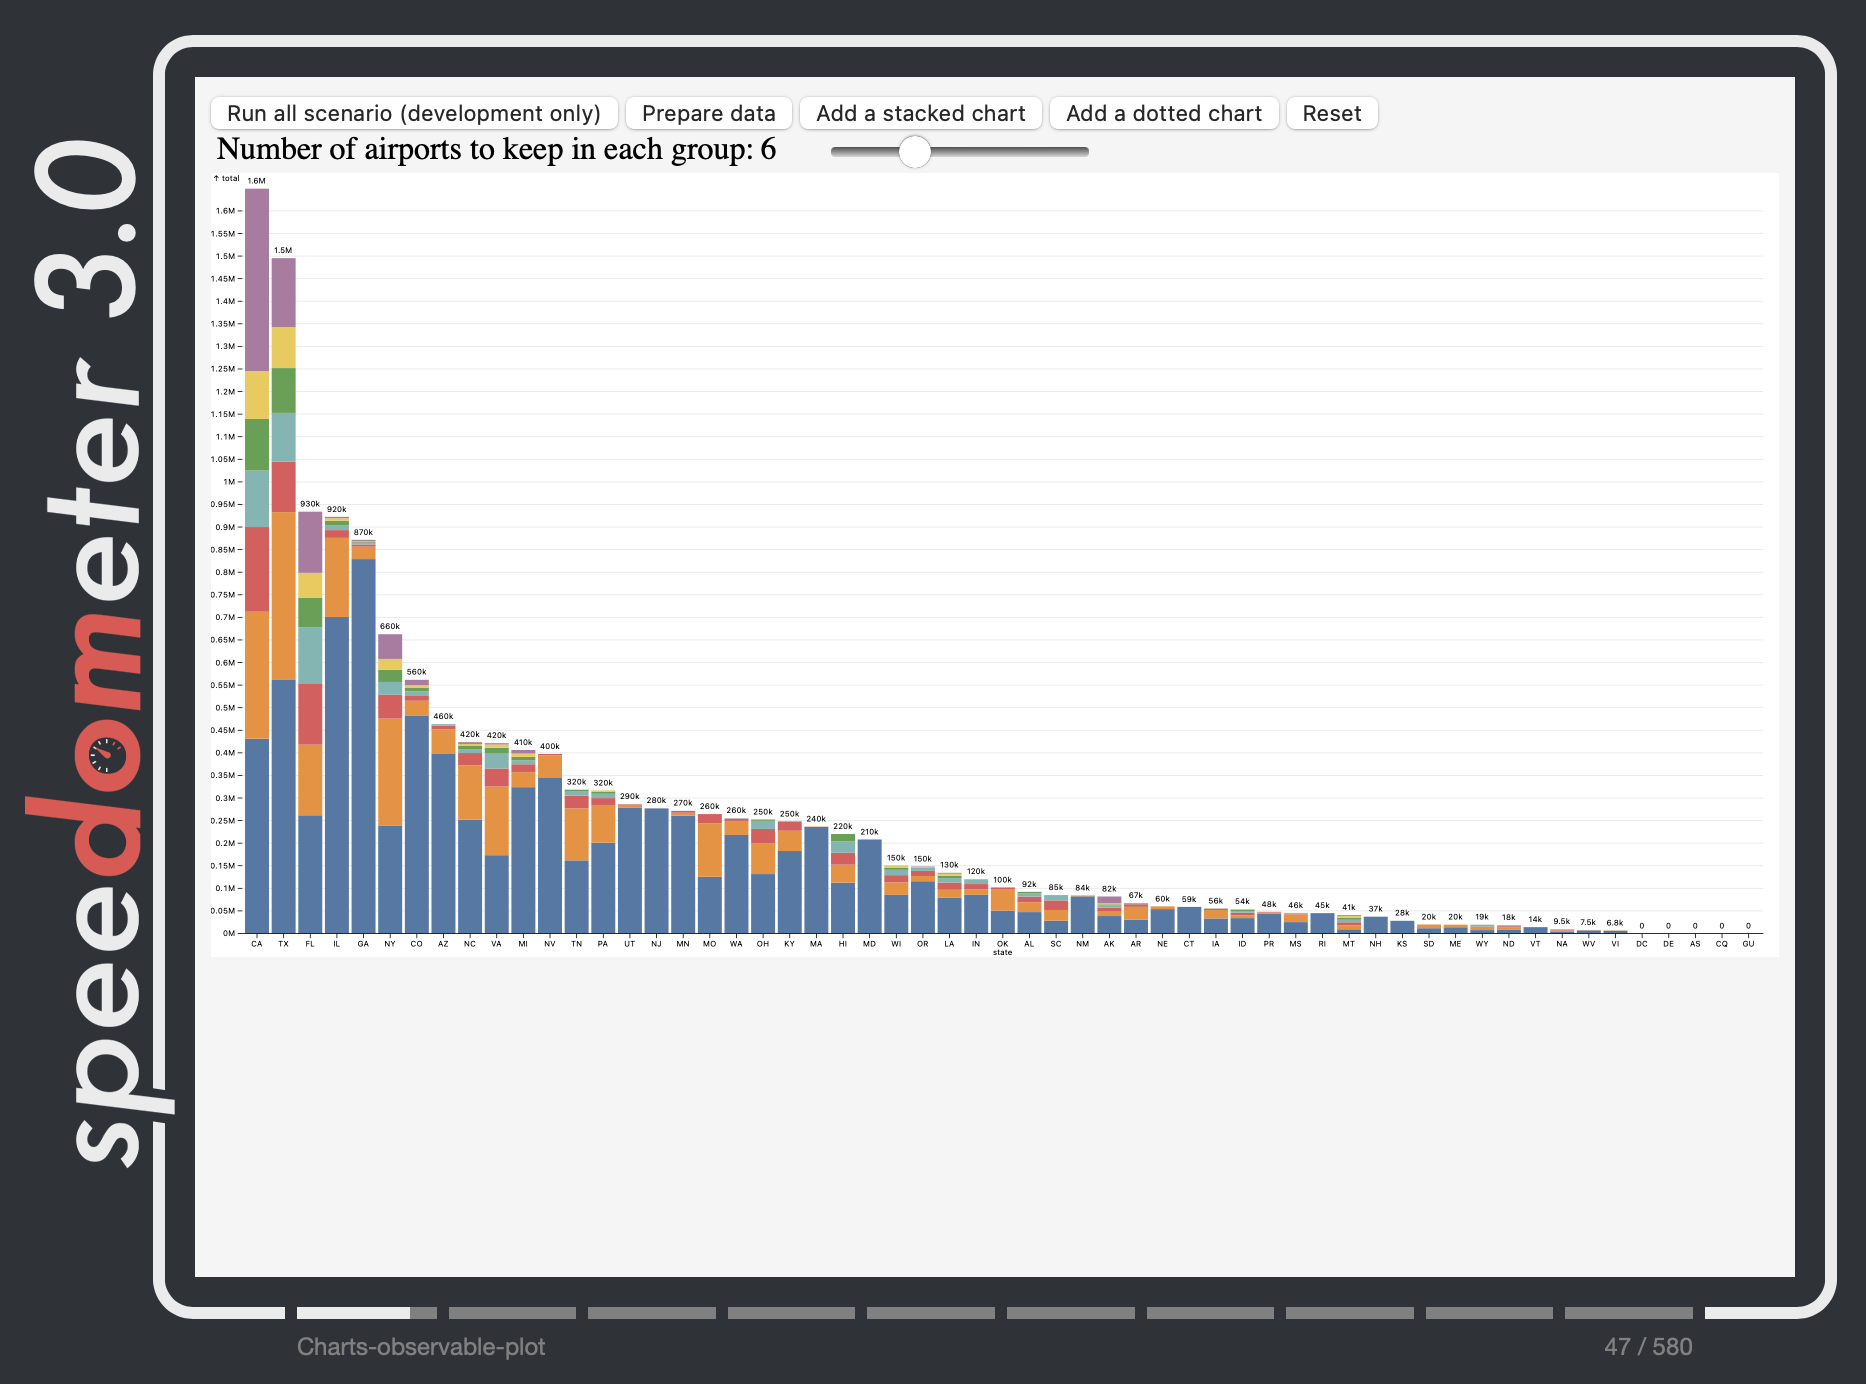
Speedometer 3.0 also includes four charting applications based on Observable Plot, chart.js, React stockcharts, and WebKit’s performance dashboards. Observable Plot and React Stockcharts are based on D3 and test manipulating SVG-based graphics. Chart.js and WebKit’s performance dashboards test drawing canvas-based graphics.
Finally, Speedometer 3.0 has added two text editing applications: a JavaScript code editor built with CodeMirror and a WYSIWYG editor built with TipTap. In both scenarios, it emulates the steps to create a new editable region, loading a large amount of text, and syntax highlighting or boldening text:
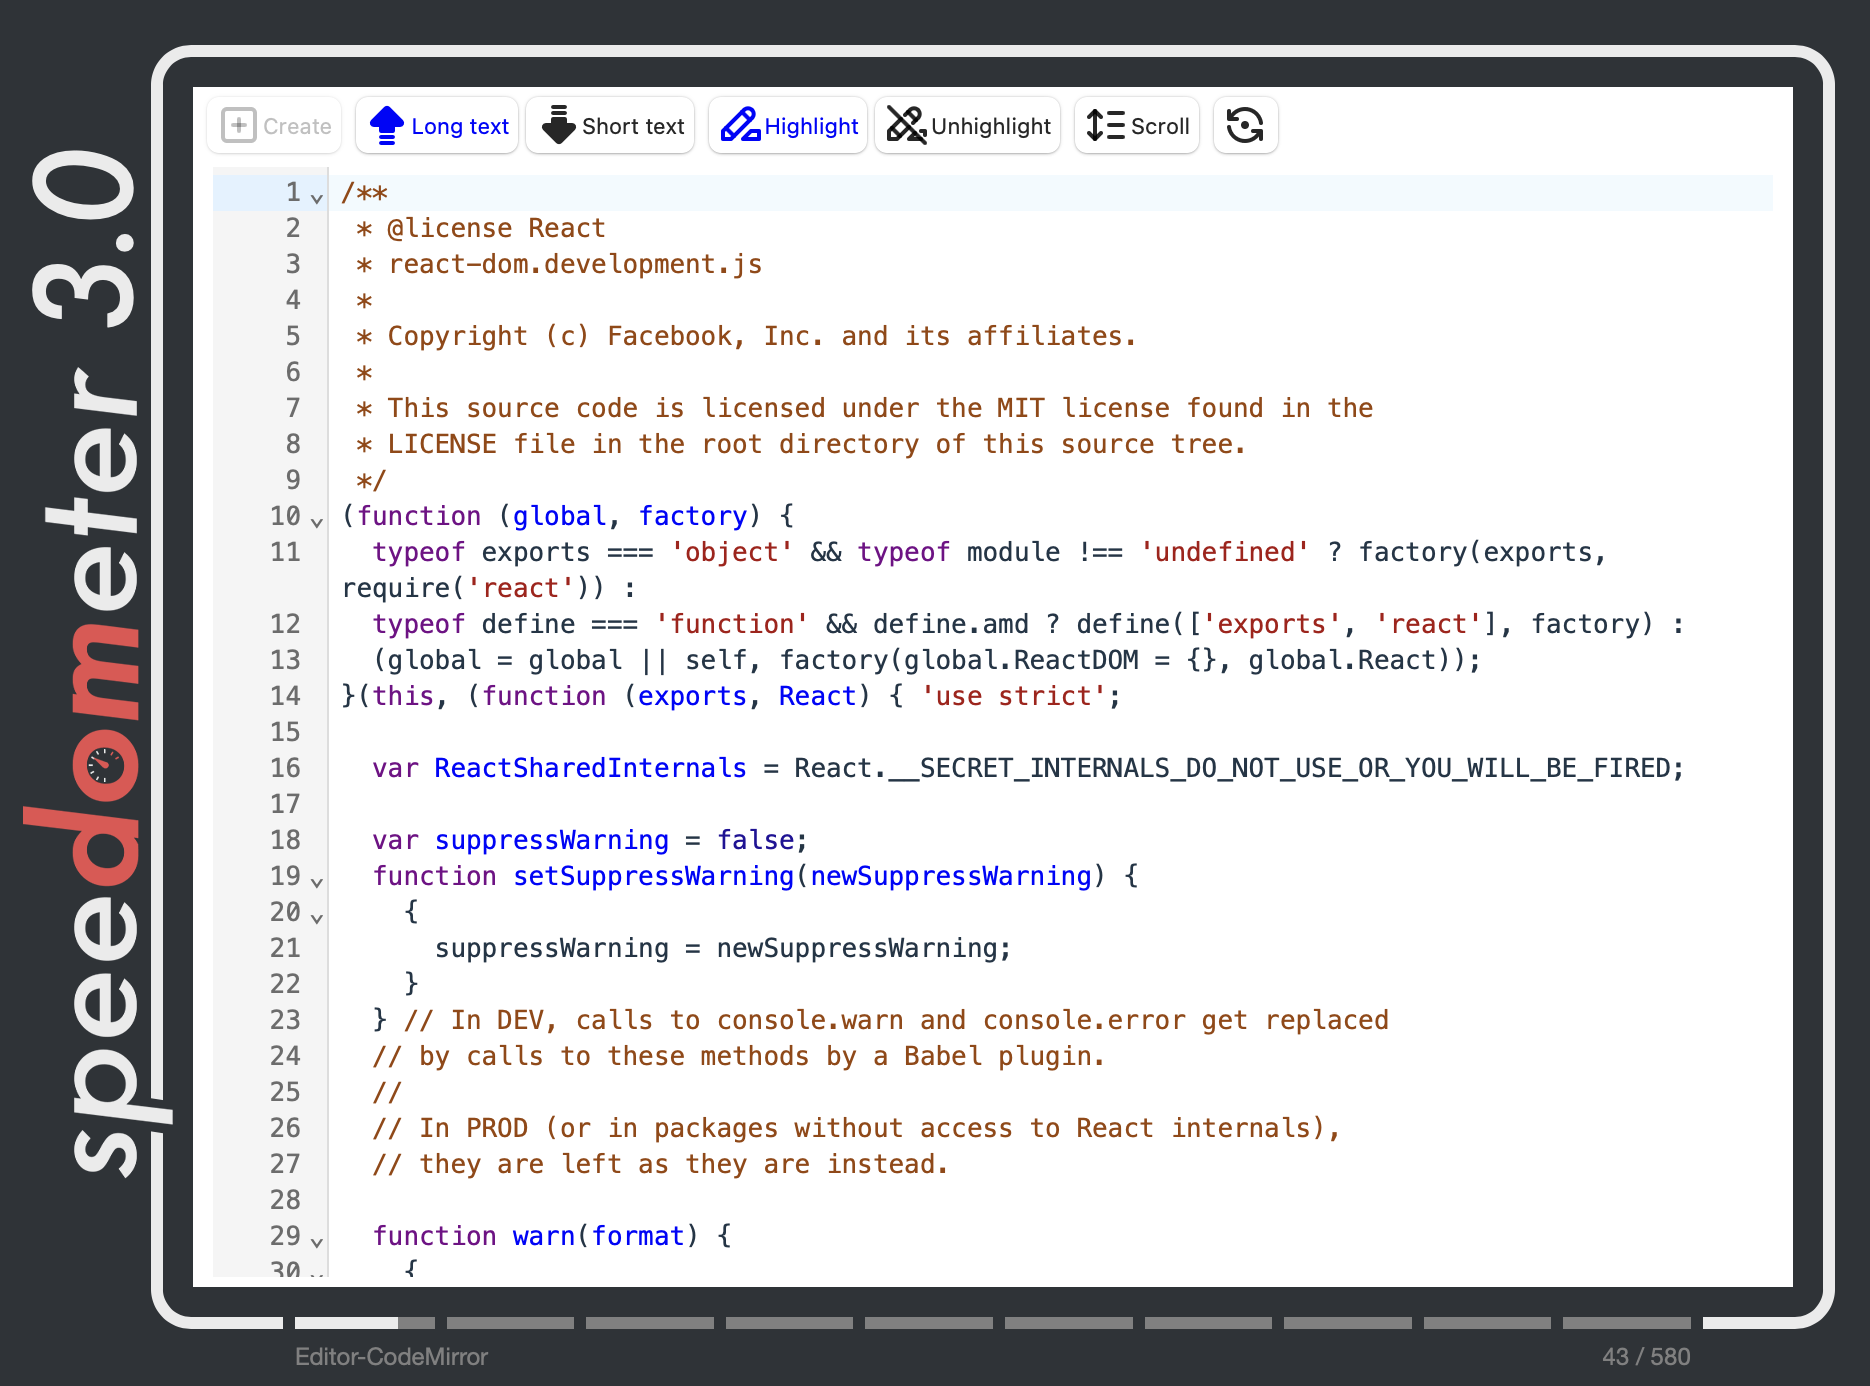
The addition of these new applications dramatically broadens the scope of what Speedometer 3.0 measures, and provide new opportunities for browser engines to optimize a broad spectrum of features like JavaScript, style, layout, graphics, and DOM.
Future Work
Today marks a remarkable milestone for the Web platform. Speedometer 3.0 sets a whole new standard for measuring web browser performance. As browser developers optimize their engines, this will expand the horizon of what Web developers can achieve in the years to come. Because the goal of the Speedometer benchmark is to reflect the real-world Web as much as possible, we’re expecting this benchmark to evolve over time. We’ll be regularly updating the list of frameworks to be tested, and periodically updating the tested framework’s versions to reflect the real world usage. You can
try Speedometer 3 benchmark on browserbench.org. If you have any feedback or questions, feel free to file issues on Github.