State of Web Inspector
Last year, Safari 6 included a reimagination of Web Inspector that aligned the design and user experience with Xcode 4. This design, while familiar to Mac and iOS developers, alienated some web developers familiar with the old Web Inspector. Over the last year we have listened and have taken all your feedback to heart.
We are happy to announce the next version of Web Inspector, released as a developer preview this week at WWDC 2013. If you regularly use WebKit nightly builds, this Web Inspector will be familiar to you, since we have been bundling it in the nightly as an early developer preview for a while now. Even though the new Web Inspector has been in the WebKit nightly build, its source has not been part of the WebKit open source project — until now.
Layout #
Web Inspector is divided into five main sections — the toolbar, navigation sidebar, content browser, quick console and details sidebar. Except for the collapsible quick console, the main content of Web Inspector is divided into three vertical sections with a master-detail relationship. As you go from left-to-right the information gets more specific. A selection in one of the navigation sidebar panels on left controls the view that is shown in the content browser in the middle. The view and selection in the content browser controls the availability and information for the detail sidebar panels on the right. This hierarchy is further represented in the navigation bar above the content browser.
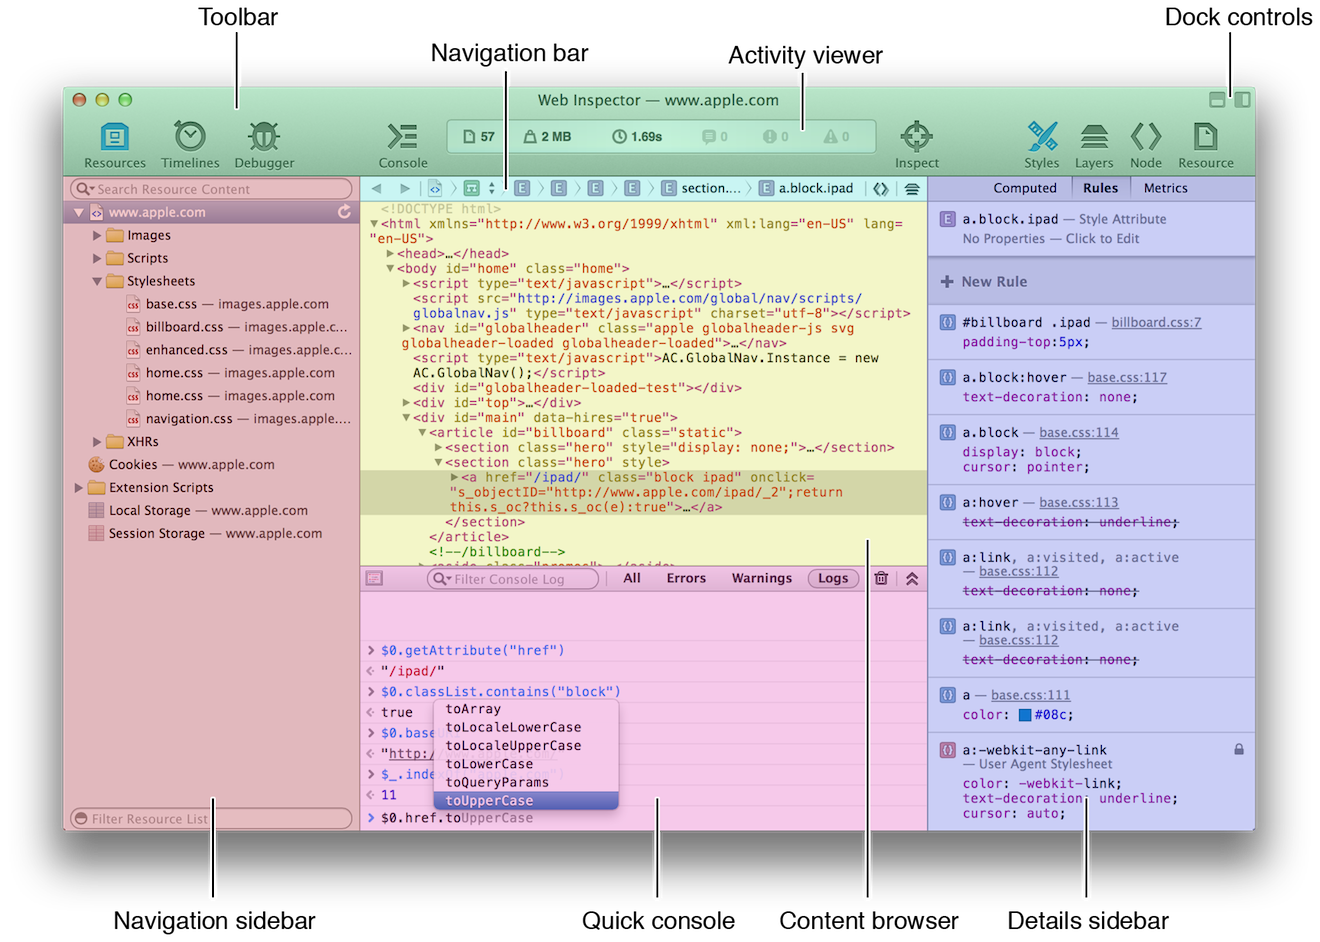

Sometimes content in the content browser can be presented multiple ways or has related content — these different views are accessed via the navigation bar. You can click on a component in the navigation bar that is decorated with double arrows to get a popup menu listing the different views available. The main example of this are frame resources which have a DOM Tree and Source Code. View selector components are not the only components you can click in the navigation bar — any component is clickable, and a popup menu of sibling components will be shown. This is handy when you need to switch resources or DOM nodes without having to go elsewhere in Web Inspector.


Toolbar #
A key focal point of the new Web Inspector is its redesigned toolbar with activity viewer. Front and center in the toolbar is the activity viewer which gives you information about your webpage resources, loading time, logs, errors, and warnings. From anywhere in Web Inspector you will be able to see, at a glance, the vital statistics of your page and if any console activity is happening. Clicking on the log, error or warning items will take you to the console and set a live filter to show only those types of messages. Clicking the same item again will toggle back to show all console messages.

The toolbar items on the far left toggle the three navigation sidebars that provide a starting point for all the content available in Web Inspector. Toolbar items on the right toggle detail sidebars that are contextually based on the view and selection currently showing in the content browser. The Console toolbar item toggles the full view console (clicking it again will take you back to the content you were looking at previously). Clicking the Inspect toolbar item places the page in inspection mode, where hovering highlights DOM elements, and clicking reveals it in the DOM Tree (this is especially handy on an iOS device where you tap elements with your finger).
When in window mode, the dock controls are in the upper right of the window, allowing you to dock Web Inspector to the bottom or right of the page. When docked, the controls are on the left of the toolbar. Holding ⌥ will toggle the undock button to let you dock to the right or bottom, depending on the current dock side.
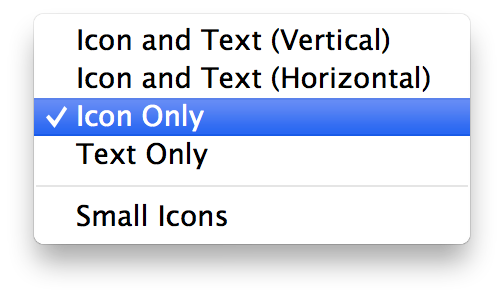 By default the toolbar items have labels for easy identification. If you would like a sleeker profile for your toolbar, you have a few customization options available in the context menu (including label visibility and icon size). The options you choose are remembered based on the dock mode — so you can have different toolbar configurations for all three modes.

Layers #
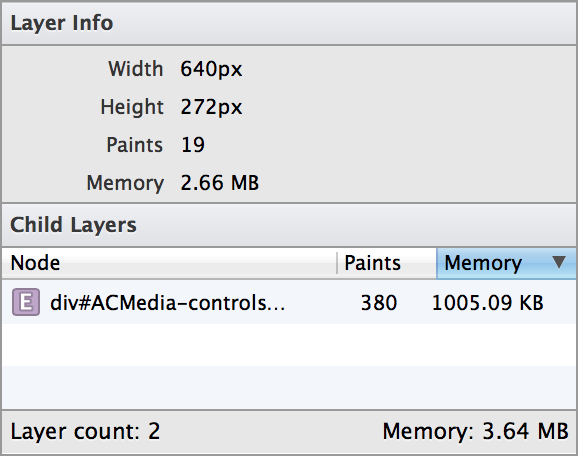 New in Web Inspector is the Layer details sidebar, providing insight into WebKit’s compositing of elements on the page. Layer info is shown for the selected DOM element (if there is a layer) as well as the layers for descendant elements. The easiest way to see all layers in the page is to inspect the <body> element and look at the child layers table. You can then dig down and narrow your list by inspecting deeper descendants. In addition to the sidebar, you can enable compositing borders (
![]()  in the DOM Tree navigation bar) that overlay the page to give you a spatial visualzation of the layers and the number of times they repaint.
 in the DOM Tree navigation bar) that overlay the page to give you a spatial visualzation of the layers and the number of times they repaint.
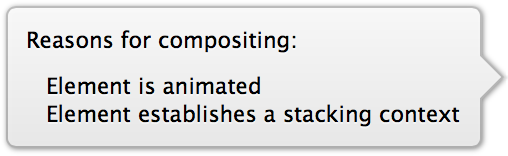 Layers can be created by WebKit for a variety of reasons, not all of which are directly controlled by the page’s styles or content. Selecting a layer in the sidebar will display a popover which enumerates the reasons that layer was created. If the layer is not required, the compositing reasons should give you direction on what changes might be needed. Eliminating undesirable layers is a straightforward way to reduce a page’s memory footprint.

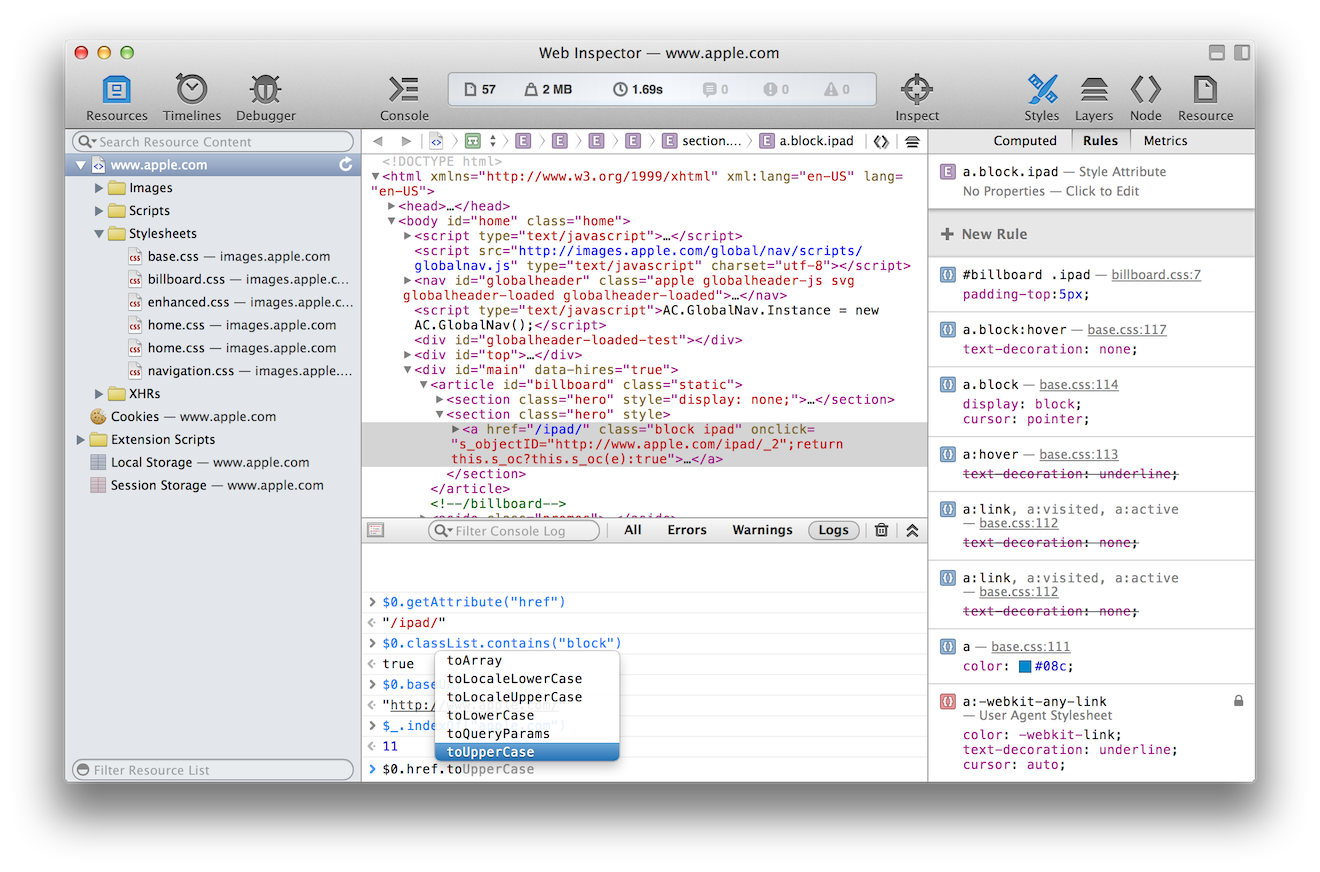
Styles #
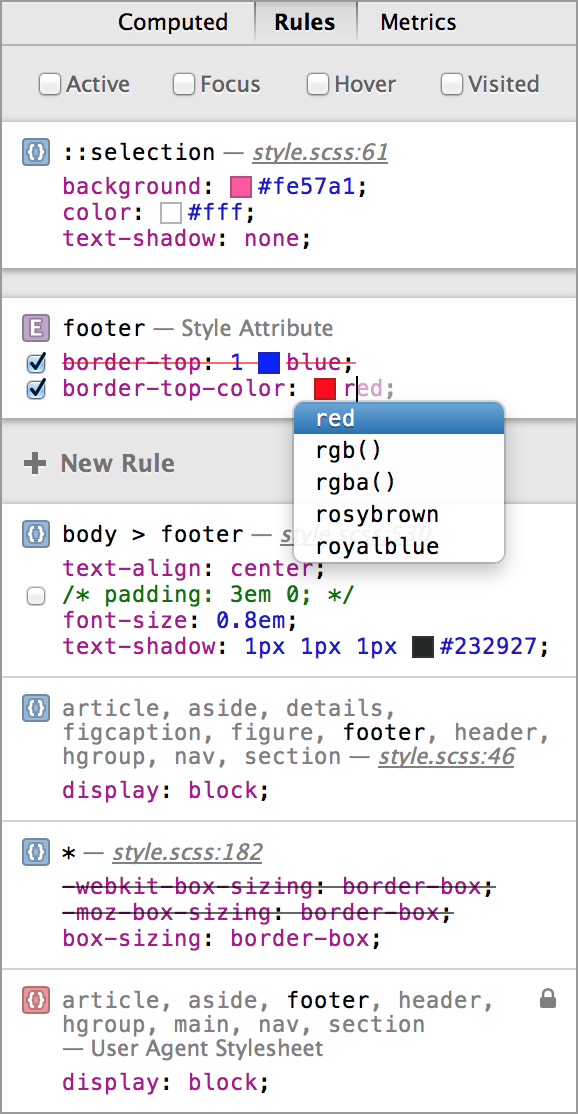 Web Inspector has an all new Style details sidebar that makes it even easier to tweak your style rules. No longer do you need to double click to edit a property or value — just click and start typing. However, unlike before, you are not limited to just that field as you edit — the whole rule body is a mini text editor. Make selections, move the cursor with your keyboard, select-all, copy, paste, smart auto-completion — it is all there — just like you would expect in a text editor. You will also see comments appear as they are in your style rules, with a toggle checkbox shown in front of any comments that look like properties. Since the arrow keys control keyboard cursor navigation, the previous key bindings for incrementing and decrementing numbers had to change. They are now ⌥↑ and ⌥↓ for incrementing/decrementing by 1 (0.1 when between -1..1) and ⌥⇧↑ and ⌥⇧↓ for incrementing/decrementing by 10.
At the top of the Style details sidebar are checkboxes to force the pseudo state for the selected element. By default these checkboxes scroll off the top of the list, so if you don’t see them just scroll up. Selecting a checkbox will force that state of the element and update the matching rules to show any that match the new state. The forced state is active until you close Web Inspector.
Any edits you make in the Style details sidebar will be reflected in the resource and vice versa. So if you prefer heavy lifting from the resource view editor, you will get the same great auto-completion of properties and keywords and live updating that you get from the sidebar.
If you favor one of the many CSS preprocessors out there, like Sass, then you will welcome support for CSS source maps. If your page references a source map that is accessible over the network or file system, Web Inspector will load it up and show the original locations of your style rules. These mapped locations show up in italics to let you know this isn’t the original location used by WebKit, but it is probably the location you care more about for local editing. Clicking the link will take you to the mapped resource. If you care to see the original resource, you can hold the ⌘ key while hovering the link, and it will point to the CSS resource WebKit is using. Some preprocessors allow mix-ins and other fancy features to make your life easier, but that also means a single rule location might not be enough to jump to a property you are interested in. To get to the actual location of the property in the mapped resource, you can hold the ⌘ key again and click on a property or value to jump right to the source code line that declares it.

Console #
 On the surface, the console might not appear like much has changed; however, under the hood, there are some big enhancements. The most noticeable change is likely the syntax highlighted prompt with smarter auto-completion. Completions are now offered in more cases and with more relevance to the context you are typing. No longer are completions only available if you are typing at the end of an expression — you are free to hop around a complex, multi-line expression and keep getting relevant suggestions.
Keeping with the smart theme, the enter key is now smarter. As you type at the end of an expression, pressing enter will now consider if the expression is ready to be evaluated or if typing more will let you finish the expression. If more could be typed to create a valid expression, then enter will insert a newline instead of evaluating the expression — handy for typing a multi-line function declaration. If you press enter with a valid expression or an unrecoverable, invalid expression, it will be evaluated, and the result or syntax error will be displayed. As always, pressing enter anywhere that isn’t the end of the expression will evaluate it. You can force evaluate anywhere by using ⌘⏎ or force a newline by using ⌥⏎.
When dealing with the console output, you now have the option to live filter by text and message type. Any messages that come in will be evaluated against the filters, and only the messages that match will be displayed. User input and its result do not go through the filter and are always displayed.
To improve exporting of console messages, a single click on a message will now make a row selection. Typical row selections rules apply, allowing for multiple row selection with the ⇧ and ⌘ modifiers. Once you have rows selected, they can be copied with ⌘C and pasted as plain text elsewhere. The full view console also supports exporting the whole log as a text file by using ⌘S. Now, we realize row selection isn’t always useful. Sometimes you only need a snippet of a result to copy and paste. For these cases, normal text range selection still works inside the boundaries of a single message. Once you drag outside of the single message boundary, it becomes a row selection and starts selecting multiple rows.
Strict mode is now also supported when paused in the debugger.

Source Code #
At the heart of many of the great new features in Web Inspector is a fantastic open source code editing component — CodeMirror. CodeMirror has enabled us to focus on building great features instead of implementing yet another code editor.

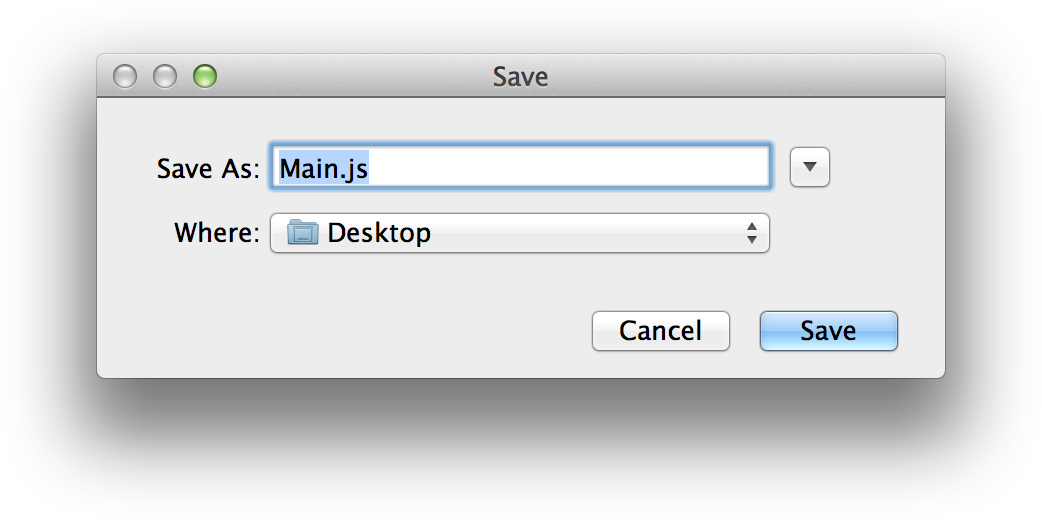
With editing playing a central part of Web Inspector, staying in the browser for all your editing is a natural desire. Having to jump back to your text editor app to make edits can be cumbersome to say the least. This is why Web Inspector allows editing of any resource loaded from file URLs, not just CSS resources. When you couple that with the new save support via ⌘S — you can now tweak, save and reload without ever leaving the browser.
 Got some source that is hard to read? Pretty printing is now available for JavaScript and CSS. If Web Inspector detects a resource might be minified, then the source code is automatically pretty printed for you. When a resource is pretty printed, any source code links with line and column numbers will be displayed in italics (like source mapped resources), indicating this is not the original location but the pretty printed location. You can hold the ⌘ key while hovering the link and it will change to show the original line and column.
Since source maps can bring in a variety of resource types beyond the standard CSS and JavaScript, Web Inspector now supports syntax highlighting for a handful of other languages. These include: Clojure, CoffeeScript, LESS, LiveScript, Sass and TypeScript.

Demos #
At WWDC 2013 we had two demo-heavy sessions on Web Inspector — Getting to Know Web Inspector and Getting the Most Out of Web Inspector. We encourage everyone to check them out for a detailed look at what the new Web Inspector can do.

Contributing #
 Now that the new Web Inspector is open source and available to checkout today as part of WebKit, we are open for contributions from developers like you. As always, Web Inspector itself is primarily HTML, JavaScript, and CSS, which means that you already have the skills needed to jump in and contribute a bug fix, enhancement or a new feature. If you’re interested in contributing or have any questions, please stop by the #webkit-inspector IRC channel.