Visualizing Layers in Web Inspector
Recent releases of Safari Technology Preview contain a new experimental feature for Web Inspector: the Layers tab. Building upon the legacy Layers sidebar, this tab introduces a 3D visualization of the inspected page’s compositing layers, to provide developers with a more hands-on (and hopefully fun!) way to understand where layers are being generated and in what order they will render.
In this post, we’ll look at how the Layers tab can be used to find unexpected memory consumption or excessive repaints on a web page.
A Whirlwind Introduction to Layers
Before introducing any debugging tool, it’s important to clarify what we’re aiming to debug in the first place. At first glance, a layer visualization may appear quite similar to a DOM visualization (such as Firefox’s Tilt), yet compositing layers and DOM elements are conceptually different entities. While web developers are intimately familiar with the DOM tree as the structure of elements on a page, the way in which these elements end up rendered on screen tends to only be learned as a need arises.
DOM elements are not just painted to the screen one by one. After the position and size of each element has been calculated, they are drawn onto a series of surfaces called layers. It is these layers which are then composited in a particular order to produce the resulting appearance of the web page. All pages have a root layer corresponding to the document itself, but any DOM element can cause a new layer to be created. Among the reasons for this are element type (e.g. <canvas>), presence of certain CSS properties (e.g. 3D transforms), or interaction with other layer-generating elements.
Layers have a significant impact on rendering performance. Without layers, animating any element (e.g. sliding a header down) would mean having to wastefully repaint the whole page on every frame. If the element has its own layer, however, it may be possible to skip repainting altogether and animate by simply recompositing the layers on screen. Of course, the trade-off for this computational savings is memory cost. Creating too many layers—intentionally or otherwise—can have disastrous results on memory-constrained devices. Like any performance concern, finding the right balance is an empirical issue, so having a suitable debugging tool is crucial!
Identifying Compositing Issues with the Layers Tab
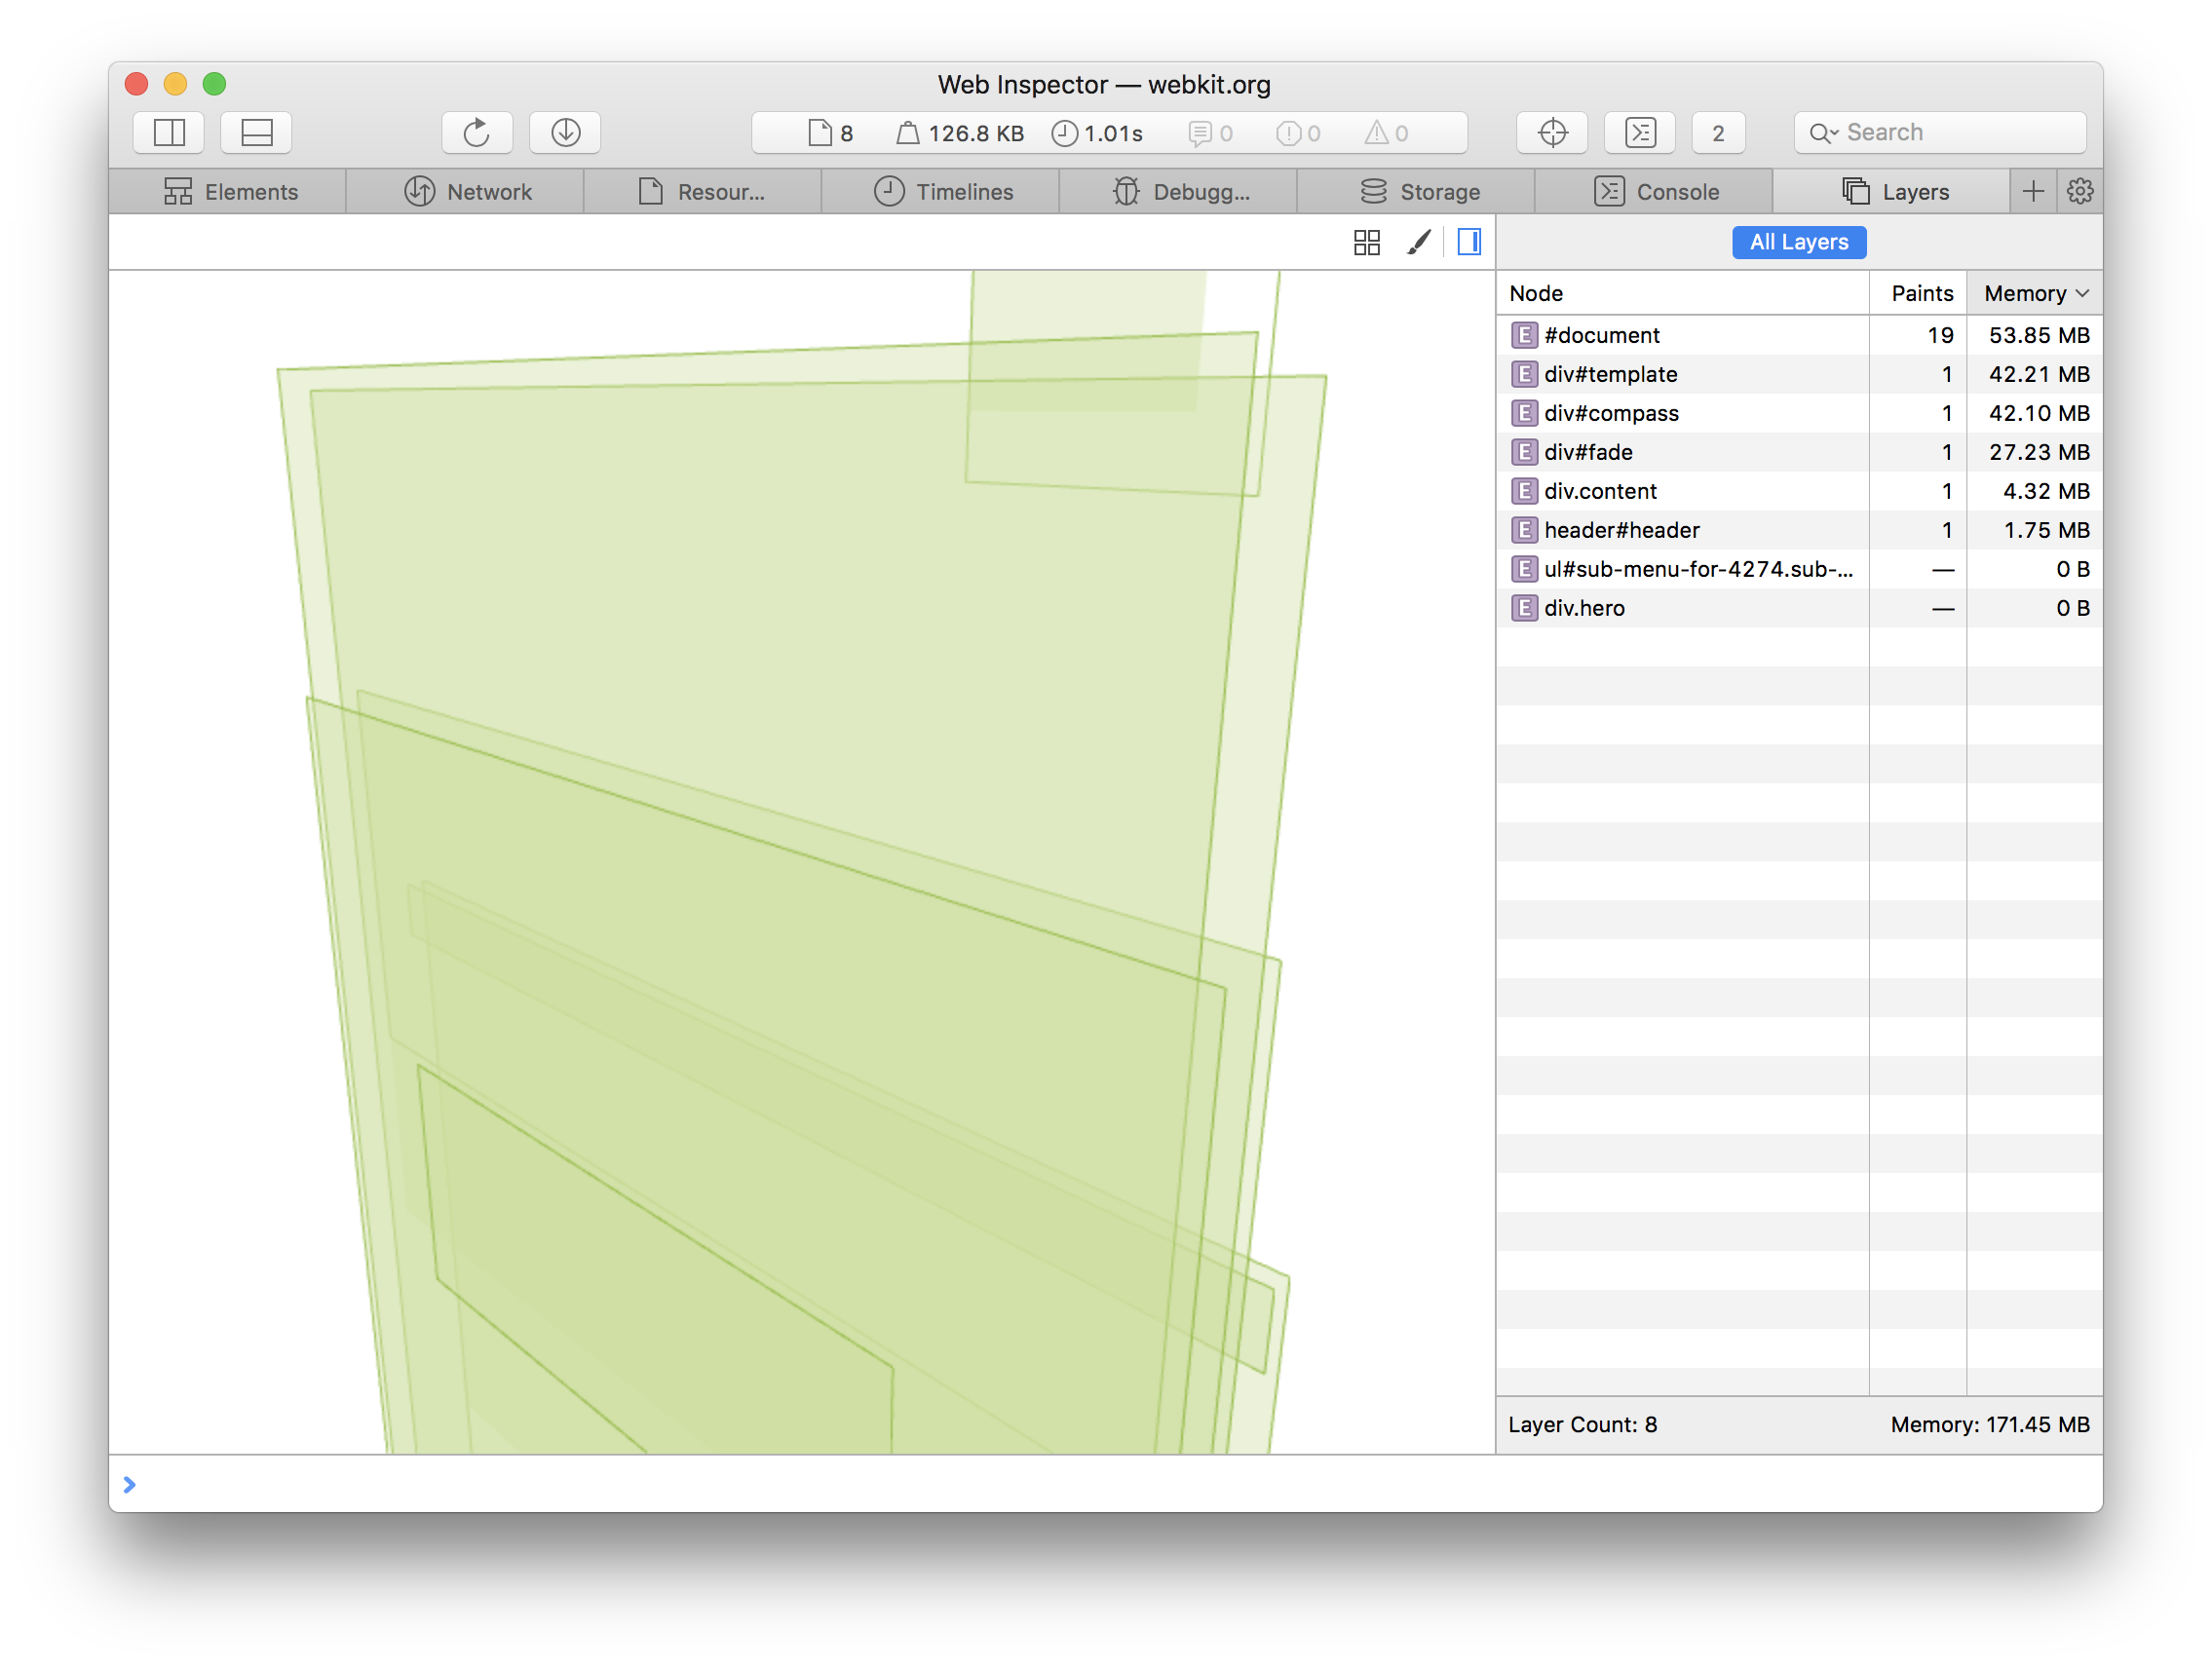
The Layers tab features two real-time representations of the layers on the page, a 3D visualization and a data table. We can use these in conjunction to discover potential performance problems.
We might begin by exploring the visualization to understand each layer’s position, size, and rendering order. To navigate, use left-drag to rotate, right-drag to pan, and scroll to zoom. Clicking a layer in the visualization highlights the corresponding row in the layer table.
We can then use the table to identify the costliest layers, sorting by Memory to prioritize memory consumption (default) or by Paints to prioritize repaint count. Selecting a row in the table displays information about why the layer exists as well as its composited and visible dimensions (visualized as an outline and a plane, respectively). This also recenters the visualization on the selection, clarifying how that layer fits into the larger picture.
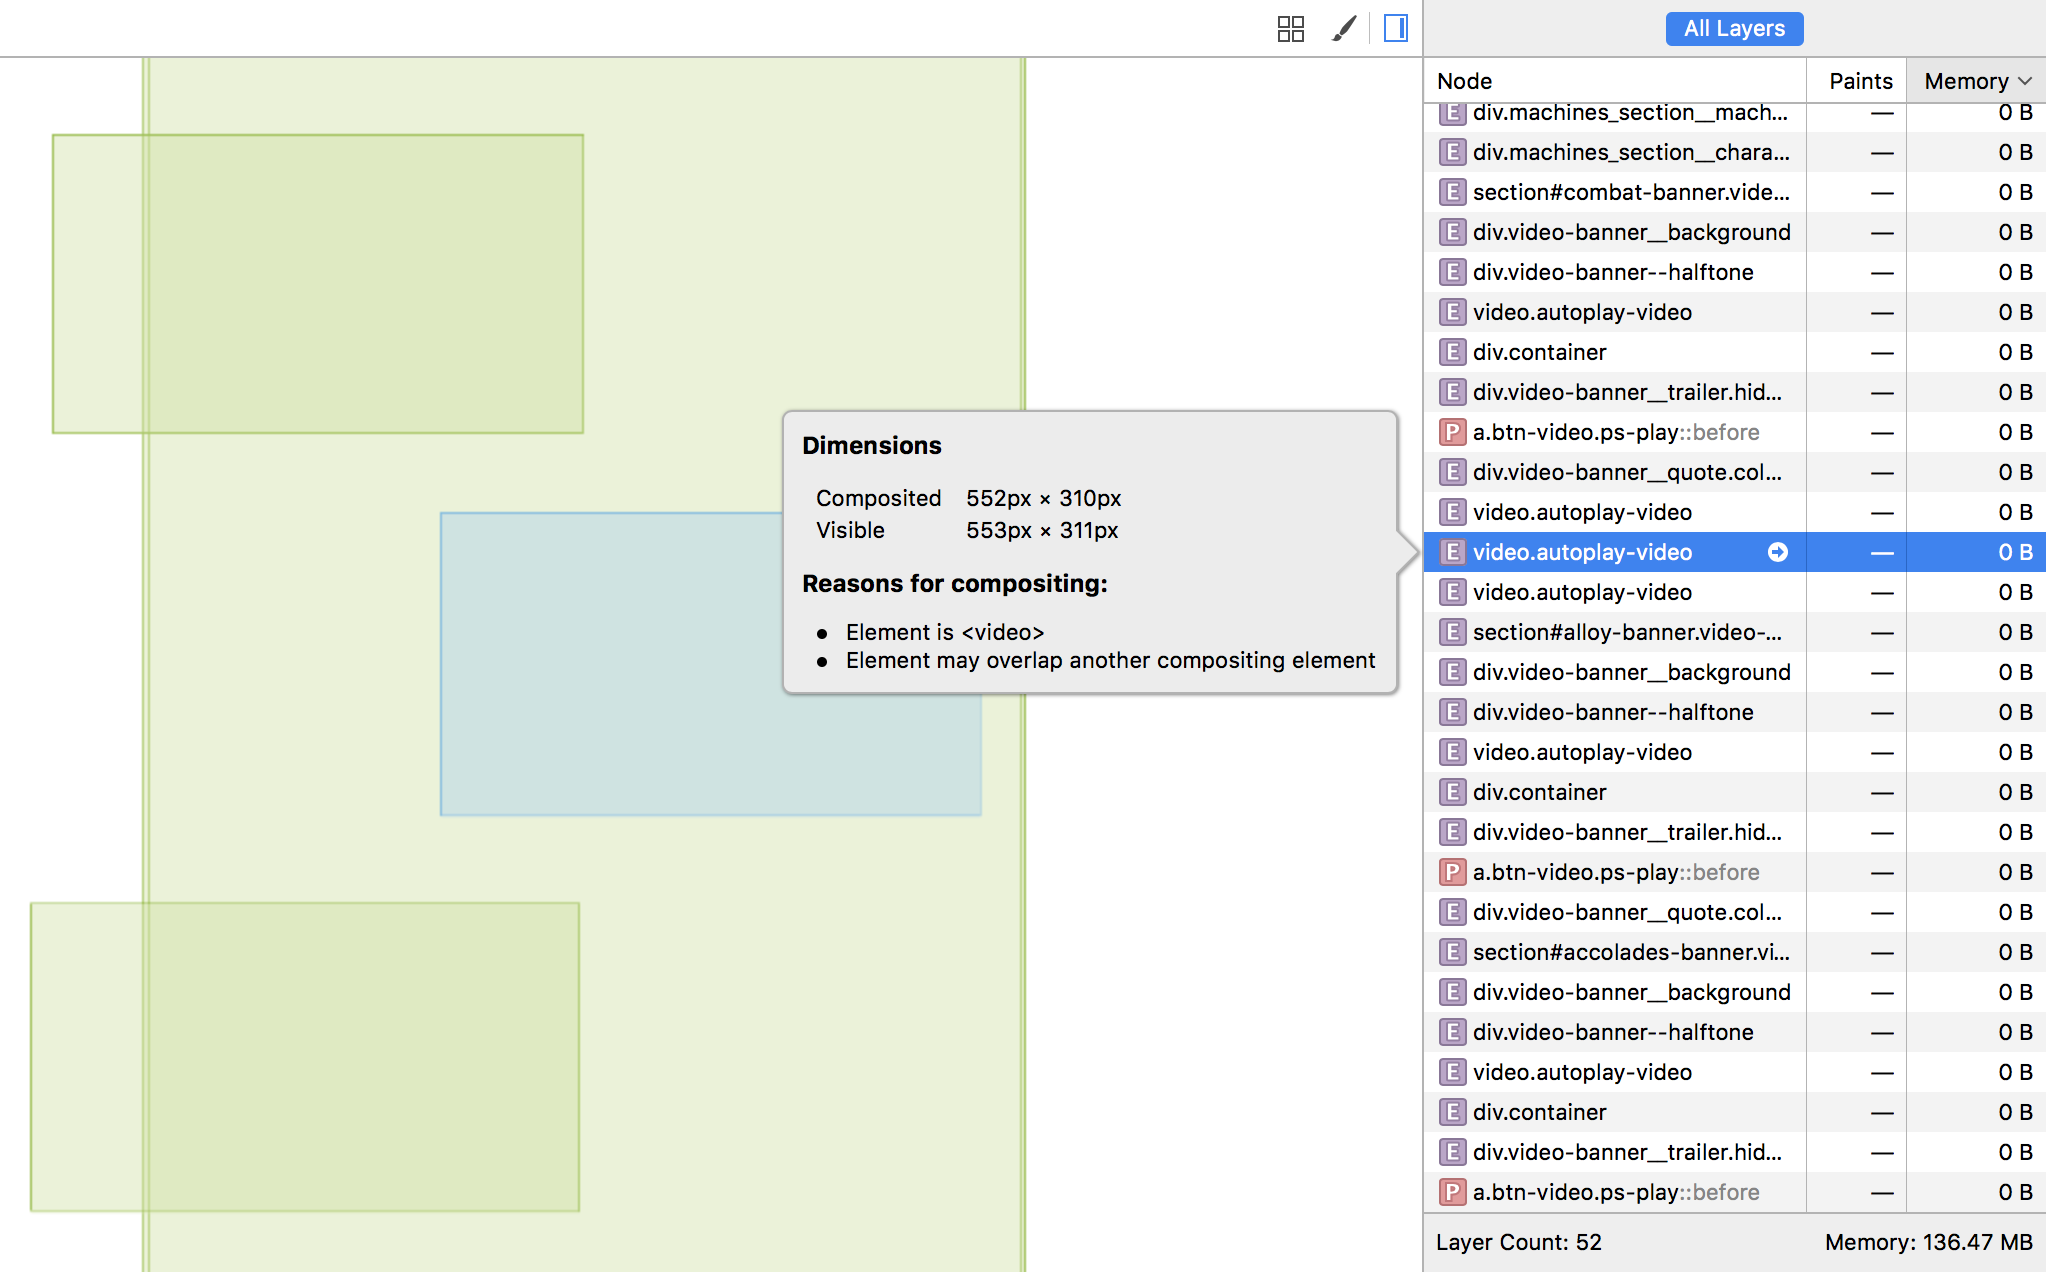
At this point, perhaps we’ll take notice of an oddly-positioned layer nearby and jump to it accordingly. Or we could simply inspect each of the most expensive layers in turn. If a layer seems suspicious, we can click the arrow icon in its table row to switch to the Elements tab and examine the DOM element that generated it. And if that’s not enough to explain an unusually high repaint count, we can turn to the Timelines tab to figure out where those paint events are being triggered.
Once we’ve identified our issue, it’s just a matter of making the appropriate HTML/CSS modifications!
Feedback
The Layers tab is available in the latest Safari Technology Preview. To enable it, visit the Experimental panel on Web Inspector’s Settings tab and check the “Enable Layers tab” setting. Give it a try and let us know what you think! Reach out at #webkit-inspector on Freenode IRC, to @webkit on Twitter, or by filing a bug.